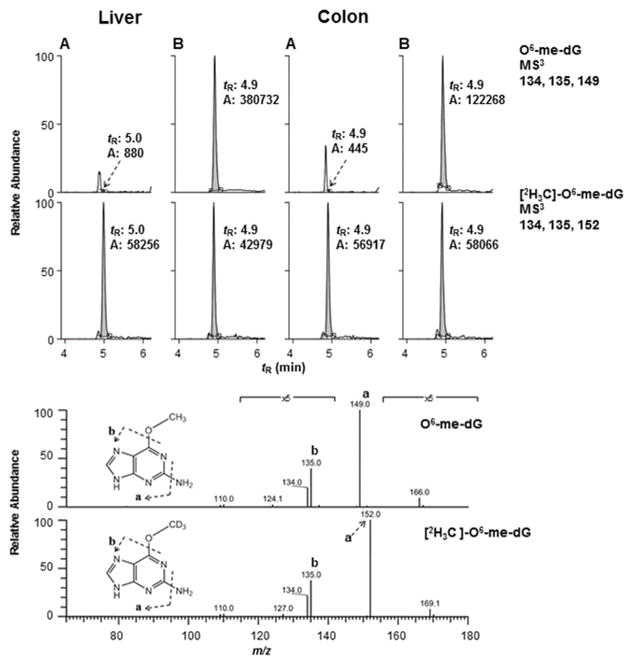
FIG. 3.
Reconstructed ion mass chromatogram at the MS3 scan stage of DNA adducts of mice control (A) and AOM-treated (B). The intensities of the ion signals of the untreated mice were normalized to the signals of the internal standards. The product ion spectra of O6-me-dG formed in liver and [2H3C]-O6-me-dG are depicted in the lower panel.

