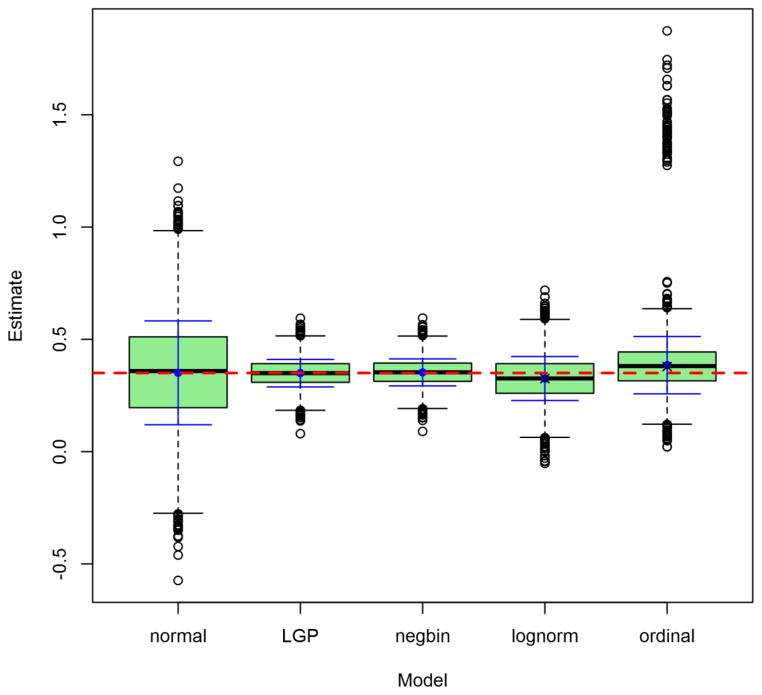
Figure 5. Observed distributions of estimated shared-environmentality, for Npairs = 1000.
Depicted results are from the 1000-twin-pair condition of the simulation. Labels on the x-axis identify the model: LGP = Lagrangian Poisson, negbin = negative binomial. Graph depicts conventional box-and-whisker plots for each model, with additional solid whiskers superimposed over them to mark the mean (filled dot) ± 1SD. Horizontal dashed line marks true raw parameter value. X’s mark true parameter values post-transformation (log(y + 1) or ordinalizing, as the case may be).

