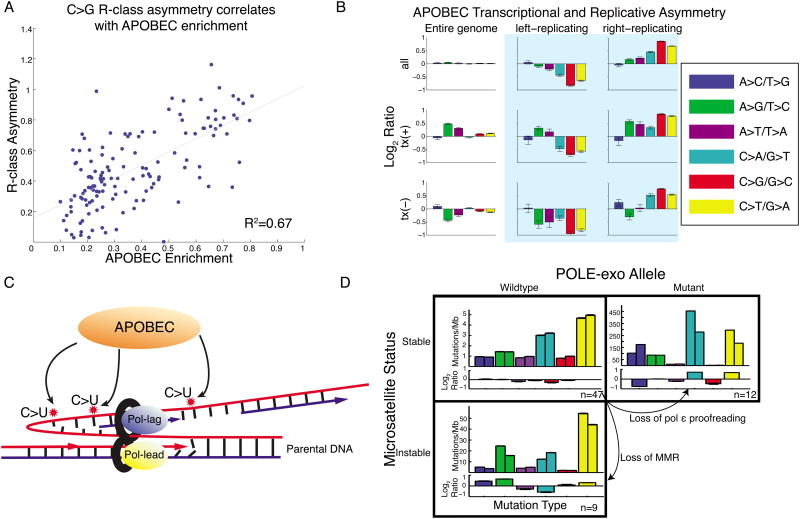
Figure 6. R-class asymmetries associated with APOBEC and MSI.
(A) Bladder, breast, and head-and-neck cohorts. Samples with highest enrichment of APOBEC signature show highest replicative asymmetry of C→G mutations. (B) APOBEC-enriched samples are dominated by replicative asymmetry (as Fig. 1E,F) (C) Proposed model: APOBEC deaminates cytosine to uracil on the ssDNA of the lagging-strand template during DNA replication. (D) R-class asymmetry in MSS, MSI, and POLE-mutant cohorts. MSS samples have little asymmetry. Loss of MMR or pol ε proofreading leads to imbalance in mutations between the leading and lagging strands.

