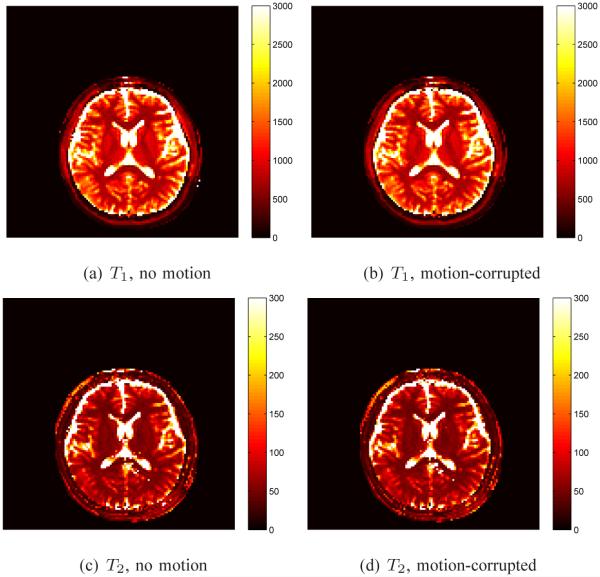
Fig. 19.
T1 and T2 maps to demonstrate robustness of the SVD method to motion. Plots (a) and (c) are the T1 and T2 maps, respectively, computed using the SVD method with the motion-free data. Plots (b) and (d) are the corresponding T1 and T2 maps computed using the SVD method with the motion-corrupted data. 200 singular vectors were used in the SVD template matching.

