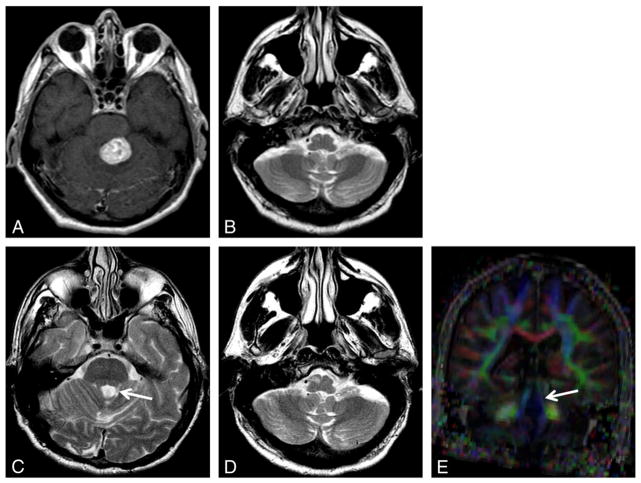
Fig. 2.
Hemangioblastoma. Axial contrast T1-weighted image (A) shows an enhancing hemangioblastoma in the superior left cerebellum. Axial T2-weighted images (B–D): Three months after resection (B), there is new hyperintensity in the contralateral inferior olive. Eight months later, there is atrophy of the superior cerebellar peduncle (C, arrow) and new hypertrophy of the inferior olive consistent with HOD (D). Coronal color FA map (E) confirms thinning and decreased anisotropy of the superior cerebellar peduncle (arrow).

