
Fig. 1.
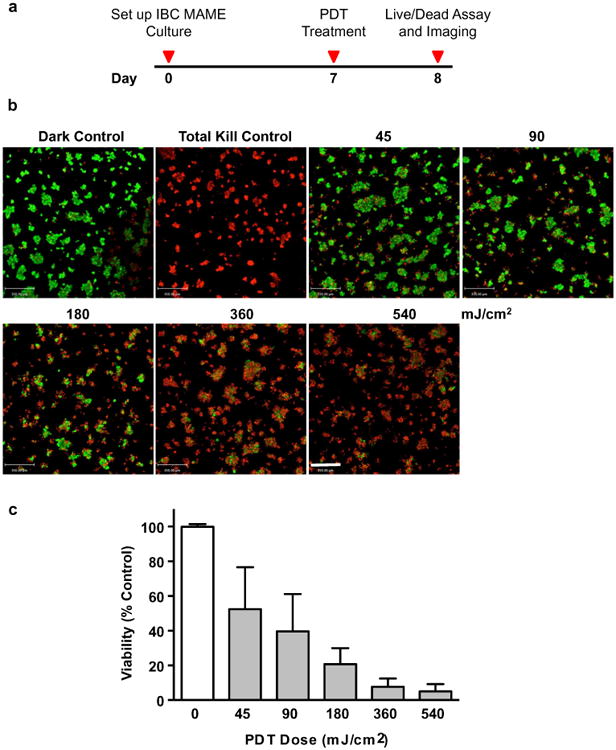
BPD–PDT induces dose-dependent photokilling of SUM149 cells in MAME cultures. Timeline shows events during PDT of MAME cultures (a). Tiled 16-panel images and z-stacks through the depth of structures were captured and reconstructed in 3D to show an en face view (b). Images show live cells (green, calcein AM) and dead cells (red, ethidium homodimer-1) and were taken 24 h after PDT with 1.5 μM BPD and for untreated dark control; scale bar equals 350 microns. Intensities of red (dead) and green (live) fluorescence were used to calculate viability that is plotted against PDT dose (c). Significance was calculated by one-way ANOVA, p-value <0.0001; n = 8, mean ± SD