Fig. 4.

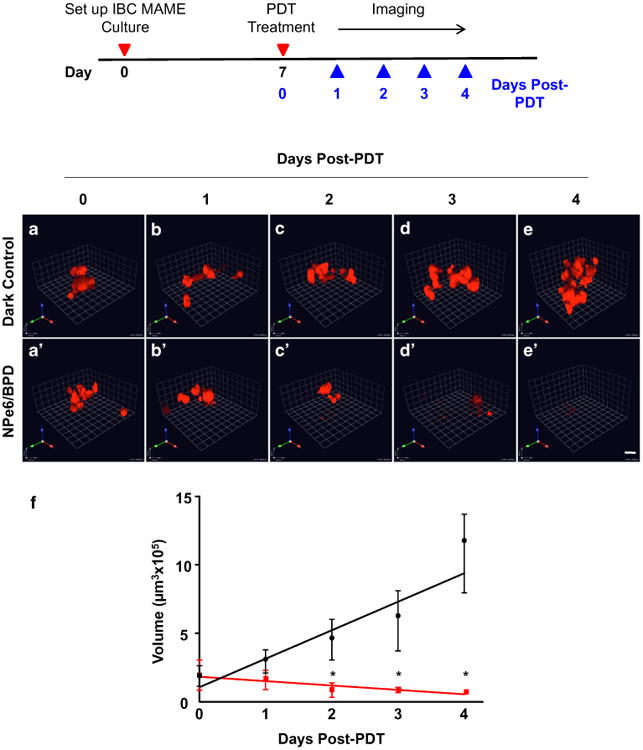
SUM149 structure volume assesses phenotypic response to the sequential PDT protocol. Schematic shows events during treatment and assessment of response to treatment. Representative 3D images of SUM149-RFP cells in MAME cultures (red) treated with sequential PDT (NPe6 followed by BPD at 22.5 mJ/cm2) (a′–e′) or untreated dark control (a–e) over 5 days after PDT: day 0 (a, a′), day 1 (b, b′), day 2 (c, c′), day 3 (d, d′), and day 4 (e, e′); scale bars equal 80 microns. The volume of structures was calculated using Volocity and is plotted against days post-treatment (f); untreated dark control (red line), NPe6/BPD–PDT (black line). Significance was calculated by two-way ANOVA. * p-value <0.0001, n = 20, mean ± SD
