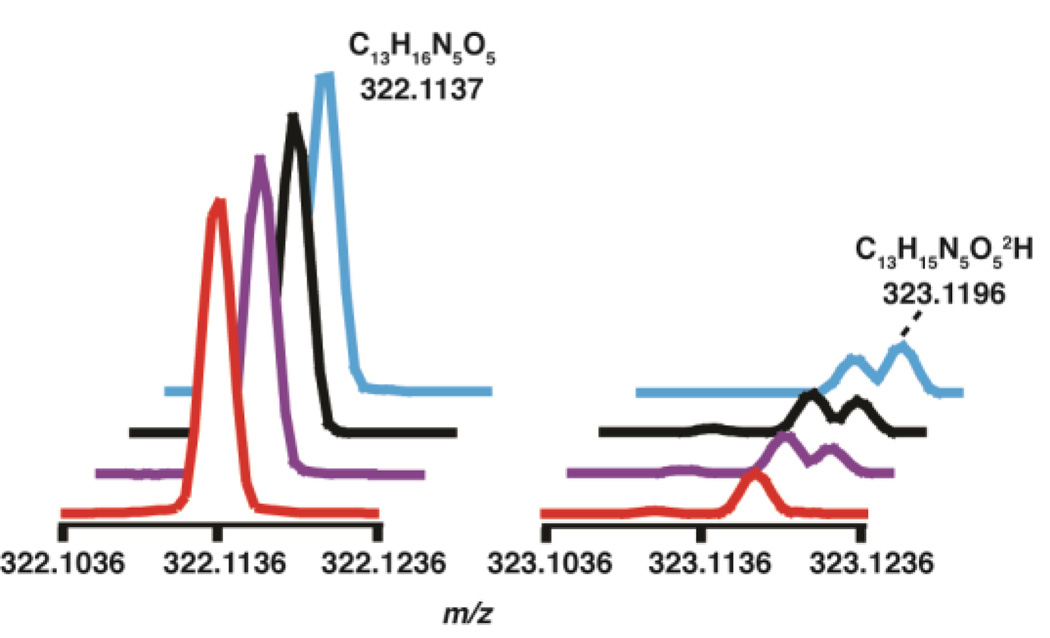
Figure 2.
The mass spectrum of imG-14 produced in the presence of protiated substrate in H2O ( ), deuterated substrate in H2O (
 ), protiated substrate in D2O (
 ), and deutertated substrate in D2O (
 ). The peak due to deuterium incorporation is labeled. The natural abundance 13C peak is visible at m/z 323.1168.

