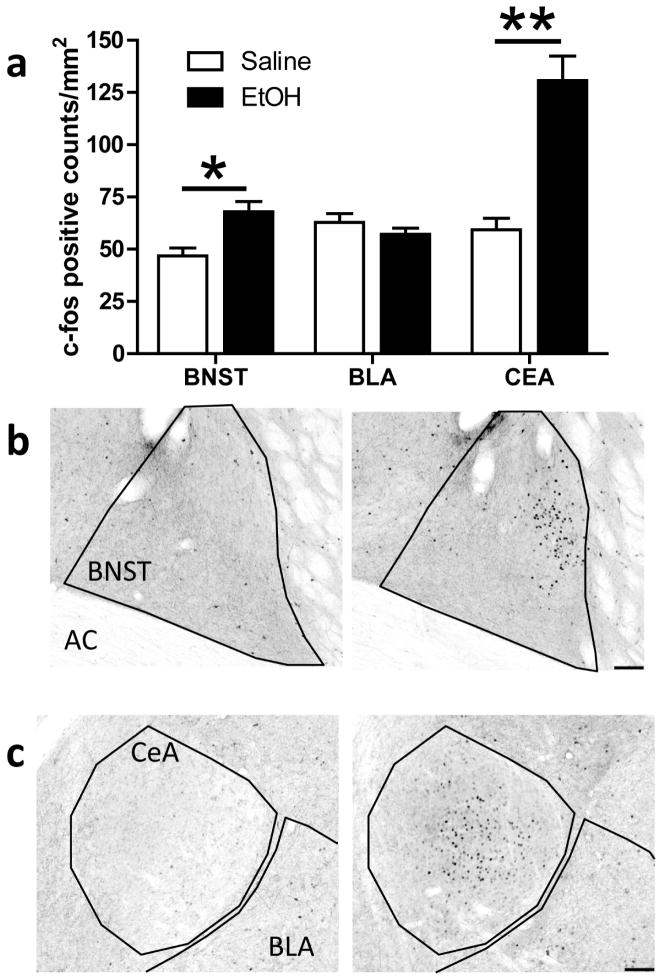
Fig. 2.
Fos-positive cell counts in the BNST, BLA, and CeA. a) Acute ethanol exposure significantly increased Fos-positive cell counts in the BNST (*p < 0.005) and the CeA (**p < 0.0001), but not in the BLA. b–c) Representative photomicrographs (10X) of Fos immunoreactivity in the BNST (b) and CeA (c) of a saline- (left panel) and ethanol-treated (right panel) animal. Scale bar = 100 microns.

