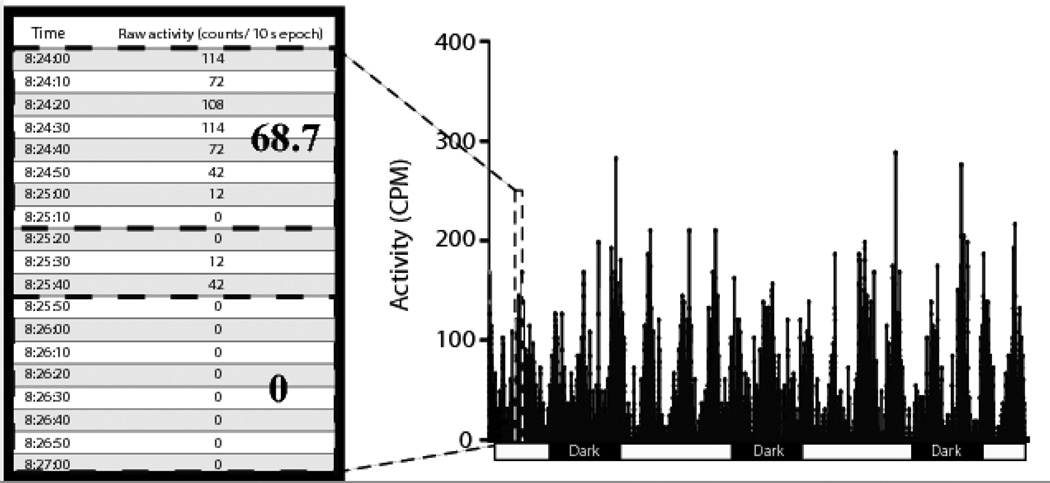
Figure 2.
Noise and variability in a continuously acquired dataset. Activity counts are extremely variable, especially during a period of high activity. The dashed box outlines the area of the graph from which the data in the table were collected. The table illustrates the variability in activity count within an activity bout – an 80 second segment with an average of nearly 70 activity counts per minute separated by only 30 seconds from an 80 second period in which no activity was recorded.

