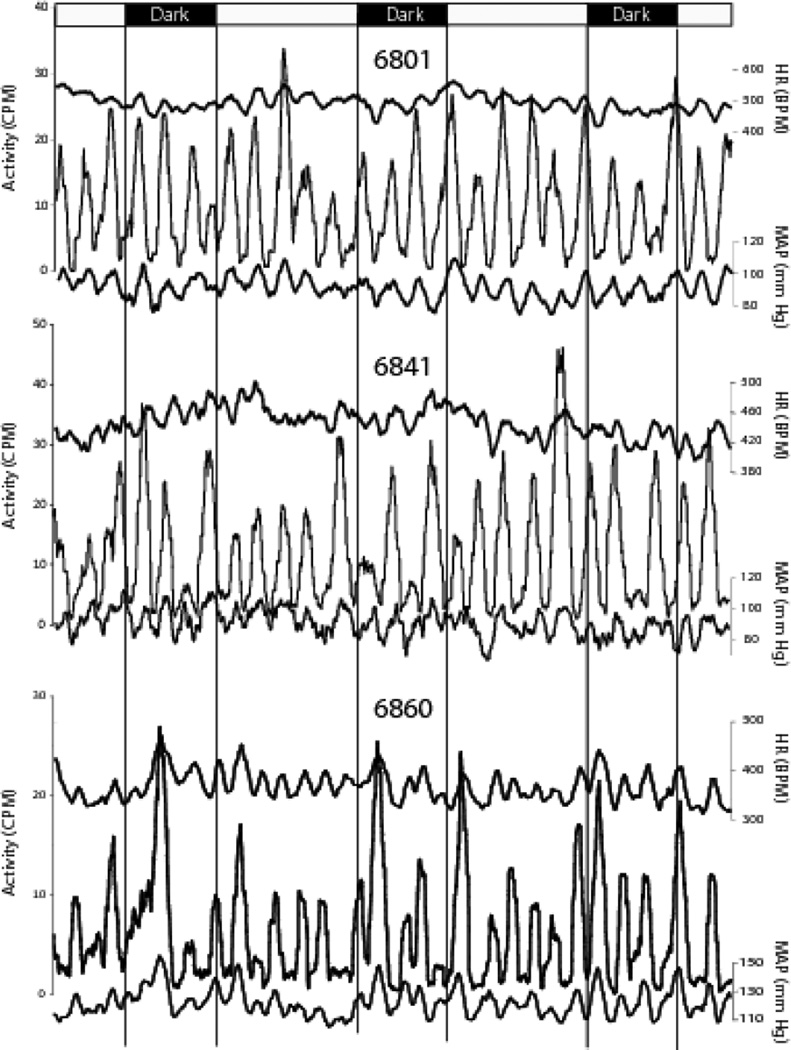
Figure 3.
Data smoothing with a 1 hr running average. Data smoothing renders activity cycles readily apparent. One-hour running averages were applied to HR, activity, and BP data. The temporal correspondence between activity (left ordinate), and HR and MAP (right ordinates) is clearly illustrated. Each set of traces illustrates 72 hours of data from one animal (identified by numbers above traces). Vertical lines delineate the 14:10 (lights on: lights off) photoperiod. Activity peaks from these and similar graphs from the remaining animals in the study were used to identify specific temporal epochs for detailed analysis of the unfiltered HR and MAP data.

