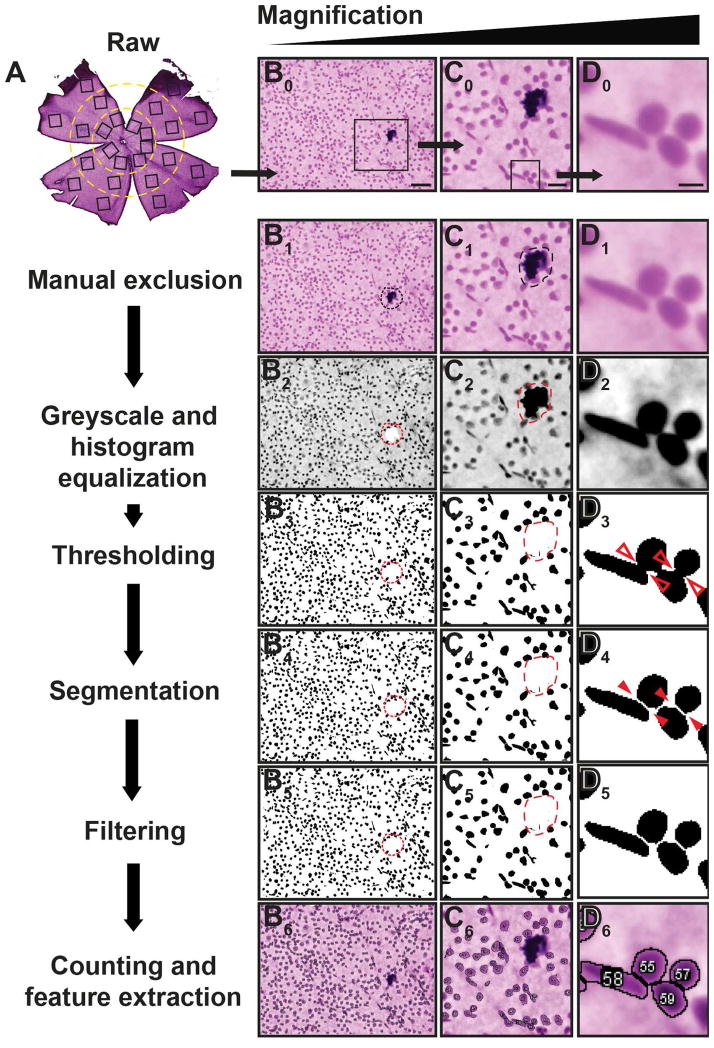
Figure 1. Processing of images for analysis in RetFM-J.
Flowchart (left, column A) coupled with images of H&E-stained whole-mount retinas at progressively higher magnification (right, columns B-D), illustrating one of the 24 fields (top row) and its subsequent processing (bottom rows). During the manual exclusion stage, artifacts such as debris (dashed circle) are disqualified from quantification for both area and cell count. All following steps, from greyscale conversion to counting and feature extraction, are performed in an automated fashion by RetFM-J. Note that most cells in close proximity to one another (open red arrowheads) are still appropriately segmented (solid red arrowheads). Scale bar = 50 μm (column A), 20 μm (column B), and 5μm (column C).

