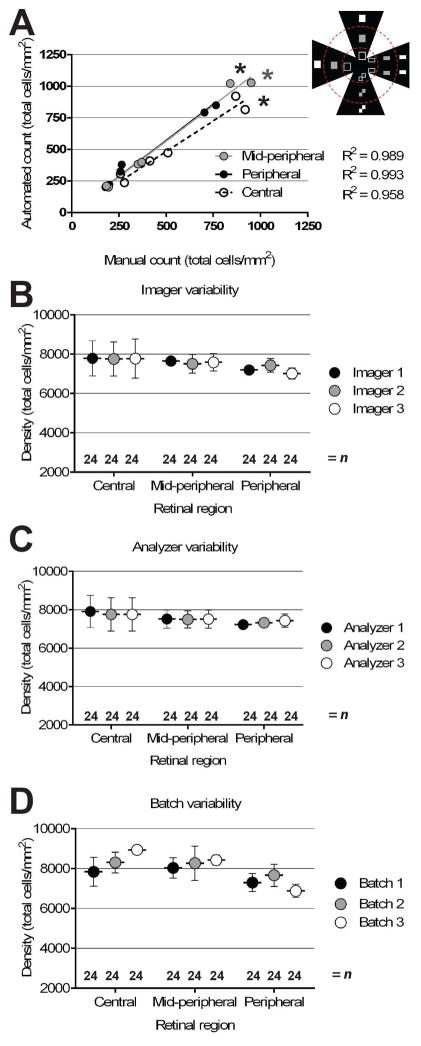
Figure 3. Quantitative evaluation of RetFM-J in performing automated cell counting.
(A) Automated versus manual counts from an identical set of images captured from differing zones of eccentricity. The image set contained images (n=18 per retina) of various sizes (n=6 for each full-, half-, and quarter-sized) from retinas of three mice, with approximate sizes and locations shown in the schematized inset. Correlations (R2) between manual and automated counts exceeded 0.95 and were strongest in the peripheral and mid-peripheral zones. (B–D) Graphs of cell density versus zone of eccentricity, showing no difference in cell density regardless of which imager (p=0.77, ANCOVA), analyzer (p=0.66, ANCOVA), or histologic batch (p=0.17, ANCOVA) was tested. C57BL/6J mice at 8–9 weeks of age; mean ± 1 SD.

