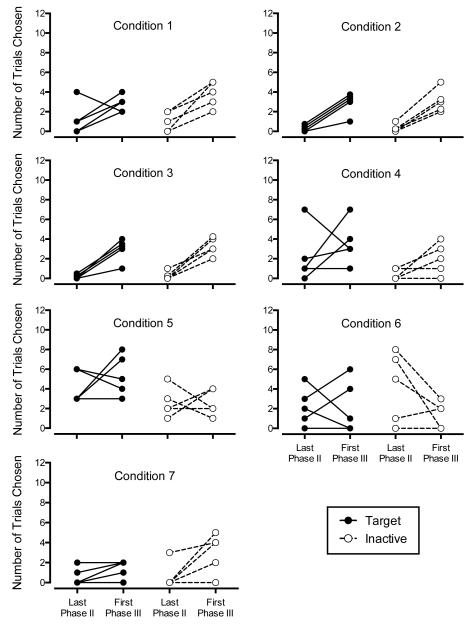
Figure 3.
Individual subject target and inactive preference from the last trial block (12 trials) of Phase II and the first trial block of Phase III for all conditions. Each participant is represented by two data points (closed circles) and a connecting solid line for the target stimulus and two data points (open circles) and a connecting dotted line for the inactive stimulus. Each panel displays five participants. Identical data series (e.g., two or more participants with the same values for the last trial bock of Phase II and the first trial block of Phase III) are offset in increments of .25 so that each participant is visible on the graph. Offset data series were only necessary in Condition 2 (three target series offset; two inactive series offset) and Condition 3 (two target series offset; one inactive series offset).

