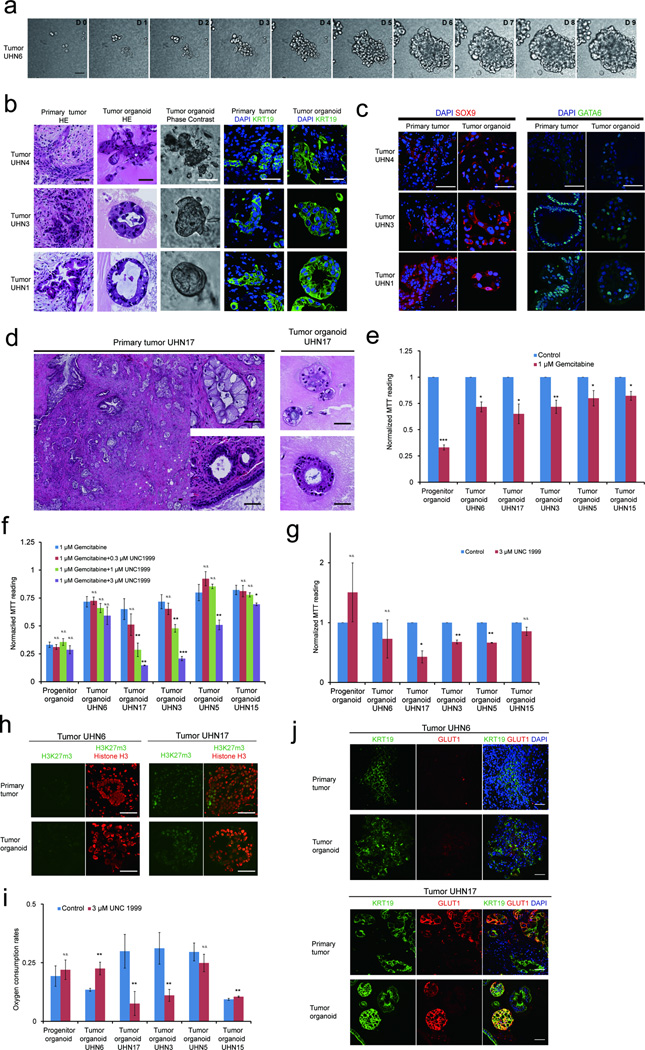
Figure 6. Establishment of tumor organoids that conserve patient specific traits.
(a) Time lapse imaging sequence of UHN6 organoids. (b) H&E, phase and immunofluorescence images for KRT19 (green) and DAPI (blue) of images of tumor organoids and their matched primary tumors. (c) SOX9 (red) and GATA6 (green) staining in primary tumors and tumor organoids. (d) H&E images of primary patient tumor and matched tumor organoids. (e) MTT assay readings of organoid cultures treated with gemcitabine for 4 days. Results were normalized to vehicle-treated organoids. (f) MTT assay readings of organoid cultures with gemcitabine and epigenetic inhibitor of the H3K27me3 writer EZH2 (UNC1999). Results were normalized to vehicle-treated organoids. (g) MTT reading of tumor organoids treated with UNC199 alone. Results were normalized to vehicle-treated organoids. See online methods for details. (h) Immunostaining for H3K27me3 (green) and histone H3 (red) in two primary patient tumors (top panel) and corresponding tumor organoids (bottom panel). (i) Basal O2 consumption rate as measured by Seahorse™ flux analyzer with and without UNC1999 treatment. (j) GLUT1 (red) expression in primary tumors and tumor organoids derived from tumor UHN6 and UHN17. KRT19 (green) and DAPI (blue). For MTT and oxygen consumptions experiments, data represent mean +/− S.D. P value (t-test, two tailed): N.S-, not significant; *P= 0.01 – 0.05; **P= 0.001 – 0.01; ***P= < 0.001 (N= 3 technical repeats). All scale bars equal to 50 µm.

