Figure 3.

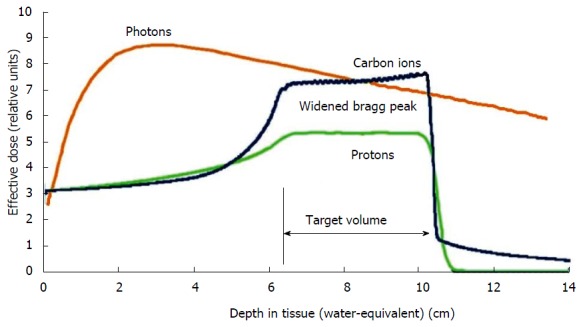
Schematic comparison of the depth dose curves of photons and particles. Lower dose distribution in the radiation path before and after the target with particles by exploiting the Bragg-peak.

Schematic comparison of the depth dose curves of photons and particles. Lower dose distribution in the radiation path before and after the target with particles by exploiting the Bragg-peak.