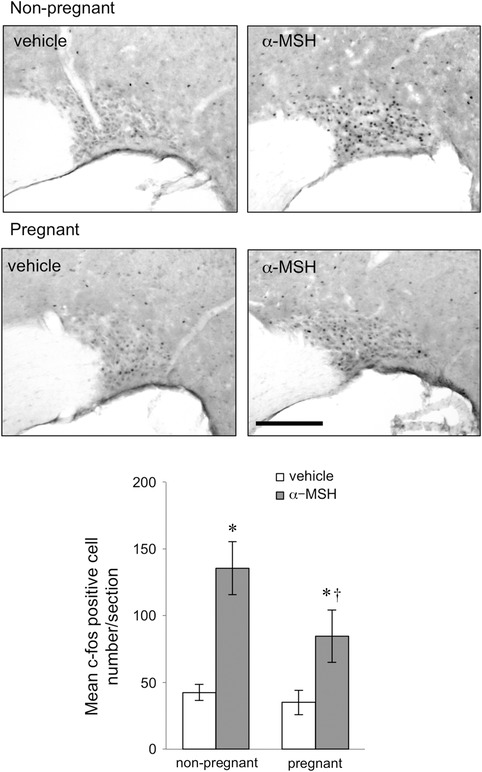
Figure 3. Expression of c‐fos in representative coronal sections of the supraoptic nucleus 90 min after α‐MSH or vehicle icv injection in non‐pregnant and day 14 pregnant rats .

Scale bar = 200 μm. Bars represent the mean ± SEM number of c‐fos‐positive cells in the supraoptic nucleus after α‐MSH or vehicle treatment in non‐pregnant and day 14 pregnant rats (n = 5–6 per group). *Significant with respect to vehicle‐treated group of the same physiological state. †Significant with respect to α‐MSH treated non‐pregnant group (P < 0.05).
