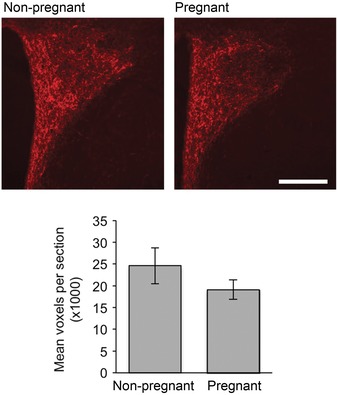
Figure 6. AgRP immunoreactivity .

AgRP‐positive immunoreactivity in the paraventricular nucleus in representative images from non‐pregnant (top) and pregnant (bottom) rats. Scale bar = 200 μm. Graph shows no significant difference in AgRP fibre density in the PVN of non‐pregnant and pregnant rats (n = 3 per group).
