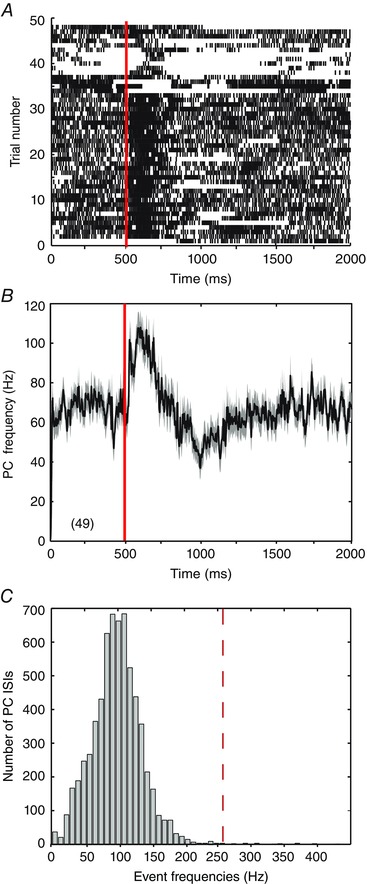
Figure 2. Sensory‐evoked cell spike patterns recorded in vivo .

Records of Purkinje cell firing to perioral whisker‐evoked stimuli delivered every 2 s in recordings from an anaesthetized rat in vivo (Shin et al. 2007). In A and B, the 100 s recording is parsed into 2 s segments in relation to perioral whisker stimulus times, with 500 ms baseline of spontaneous firing preceding a stimulus and 1500 ms following (total of 49 stimuli per recording). Red lines at 500 ms indicate the timing of individual perioral whisker stimuli. A, raster plot of the timing of spike discharge in relation to each of the 49 separate perioral whisker stimuli, shown as individual rows. B, mean frequency of Purkinje cell firing as shown in A for all 49 sensory stimuli, with the grey shaded area reflecting the SEM. C, histogram of instantaneous event frequencies for the records shown in A. Red dashed line indicates the reported somatic spike frequency of 257 Hz at which axonal condition becomes less reliable (Monsivais et al. 2005).
