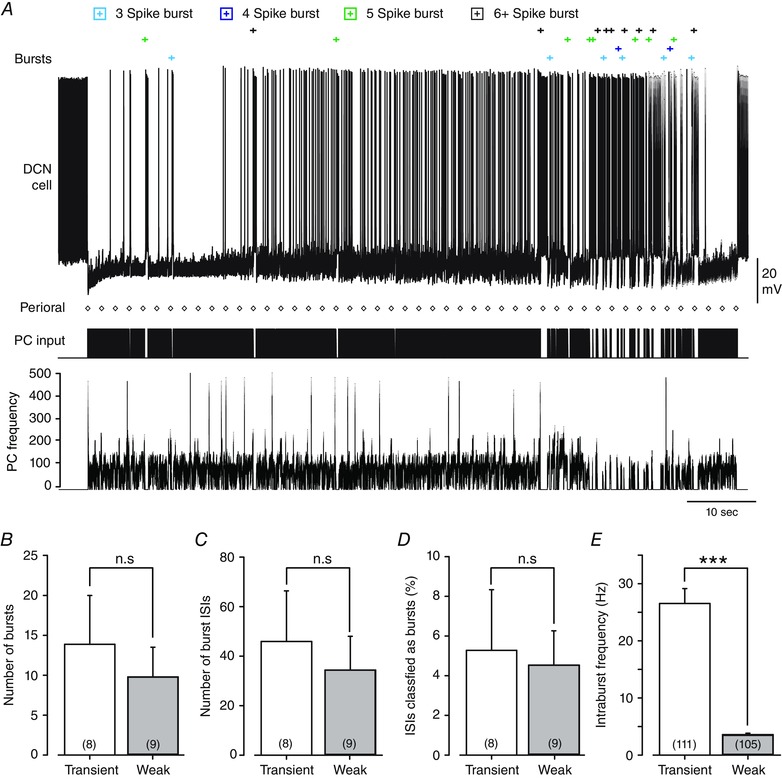
Figure 4. The DCN cell response to a physiological stimulus pattern of inhibitory synaptic input in vitro .

A, a representative Transient burst cell response to the Purkinje cell stimulus template over a full 100 s of stimulation. ISIs that are statistically defined as falling inside the burst criteria are marked at the top (Bursts), with the timing of the first spike of bursts identified according to the legend at the top. The timing of Purkinje cell input is shown below (PC input) together with instantaneous frequency. The timing of each perioral stimulus originally delivered in vivo is shown by diamonds (Perioral). B‐E, bar plots comparing burst discharge of Transient and Weak burst cells in response to the Purkinje cell input train shown in A over the 100 s of all recordings. No statistical differences were detected between Transient and Weak burst neurons in terms of the number of bursts detected (B) (P = 0.57), the number of burst ISIs (C) (P = 0.64) or the percentage of ISIs belonging to the burst category (D) (P = 0.83). E, transient burst cells exhibit a significantly higher mean intraburst frequency compared to Weak burst cells. Sample values shown in parentheses in B–D reflect total animals used, and those in E the total number of bursts in all recordings. Values are mean (SEM) by two‐sample t tests; ***P = 2.3 × 10⁻¹⁵; n.s., not significant.
