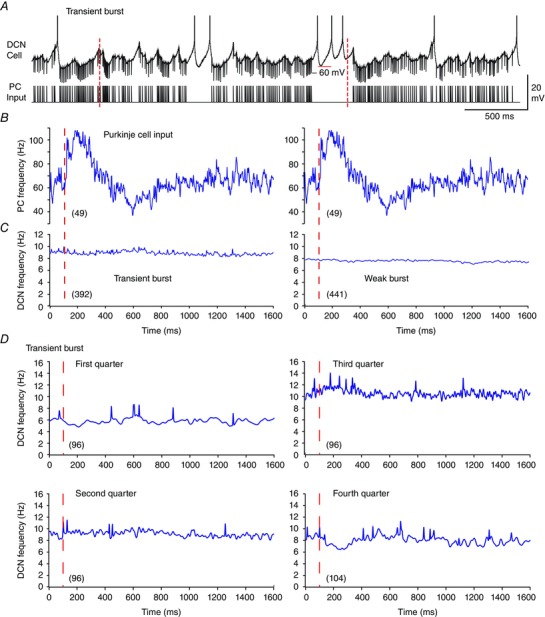
Figure 5. Purkinje cell input patterns associated with perioral whisker stimuli do not reliably evoke burst responses in DCN cells .

A, a representative and expanded segment of a recording from a Transient burst neuron with the structure of the Purkinje cell input train below. Dashed red lines indicate the timing of two perioral whisker stimuli originally delivered in vivo. B and C, the mean Purkinje cell firing rate (B) for 49 perioral whisker stimuli (red dashed lines) is positioned above the corresponding mean firing frequencies of Transient and Weak burst DCN cells (C). Data are averaged over all stimuli from eight Transient burst cells (left, 392 stimuli) and nine Weak burst cells (right, 441 stimuli), with records spanning from 100 ms preceding to 1500 ms following the stimuli. Note that DCN cell frequency is shown on an expanded scale compared to Purkinje cell input frequency and spikes are truncated in A. D, mean frequency plots of the DCN cell response in each successive quarter (25 s) of the 100 s Purkinje cell stimulus in the case of Transient burst neurons in relation to perioral stimuli as in B and C. The first three quarters each contain 12 perioral whisker stimuli, and the fourth quarter contains 13 stimuli, averaged across all cells in each burst phenotype. Total Purkinje cell stimulus numbers are shown in parentheses.
