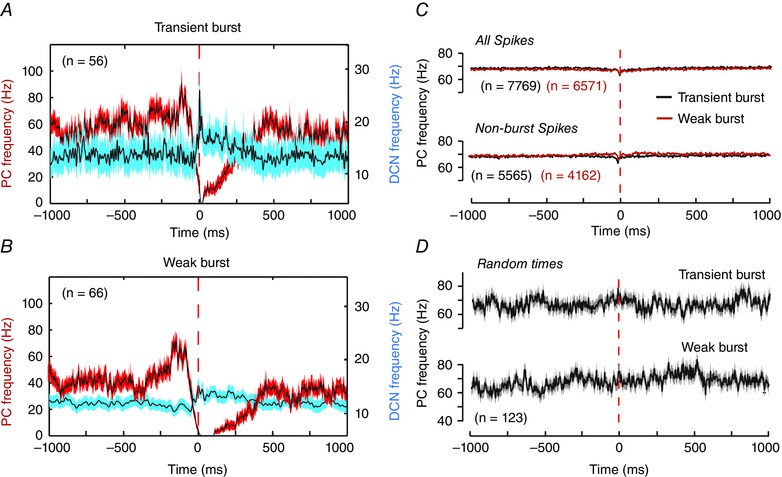
Figure 6. Reverse correlation reveals the Purkinje cell firing pattern that evokes DCN cell burst ISIs .

A and B, superimposed mean frequency plots of the Purkinje cell firing rate (red traces) and the associated DCN cell response (blue traces) for Transient burst (A) or Weak burst neurons (B). All data were extracted according to reverse correlation of Purkinje cell firing rates in relation to the timing of the first spike (0 ms) of all statistically defined DCN cell bursts of 3–8 ISIs irrespective of the time of perioral whisker stimuli. Frequencies are shown for data recorded 1 s before and after the timing of the first spike of a defined DCN cell burst. The data are averaged over all bursts collected from eight cells for Transient burst neurons (n = 56) and nine cells for Weak burst neurons (n = 66). C, superimposed records of the mean Purkinje cell firing rates in Transient and Weak burst cells identified when considering all Purkinje cell spikes irrespective of DCN cell burst ISIs (All spikes), or only the Purkinje cell spikes not associated with DCN cell bursts (Non‐burst spikes). D, mean Purkinje cell firing rates calculated in relation to random times of DCN cell responses not reflecting burst responses as controls for any potential non‐white noise statistical structure in the Purkinje cell input. All data are plotted on the same scale for comparison. Traces represent mean values (black lines) with SEM indicated by the shaded areas in A, B and D.
