
Figure 7. The intensity of a DCN cell rebound burst is strongly correlated to the duration of a pause in Purkinje cell firing .
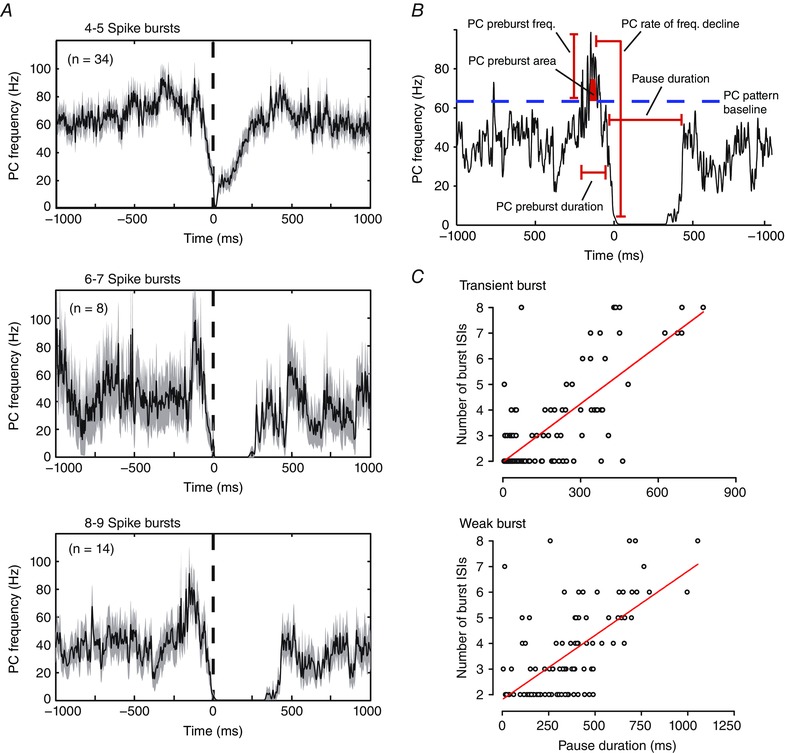
A, average frequency plots of the Purkinje cell firing rate extracted by reverse correlation in relation to the timing of the first spike (0 ms, dashed line) of all Transient DCN cell bursts consisting of the indicated number of ISIs. B, representative average Purkinje cell firing pattern identified through reverse correlation as evoking 8–9 spike bursts in Transient burst cells. Time 0 reflects the timing of the first spike of each statistically defined DCN cell burst ISI. The parameters of Purkinje cell firing measured are indicated, with Purkinje cell frequencies measured with respect to the mean firing rate over the entire 100 s stimulus input (dashed blue line). C, scatter plots of the duration of pauses in Purkinje cell firing (as defined in B) for Transient and Weak burst cells in relation to the number of ISIs in each DCN cell burst. Records include all bursts present across eight Transient burst neurons and nine Weak burst neurons. Traces in A reflect mean values (black lines) with SEM indicated by the shaded areas. Red lines in C reflect linear fits to the data. See also Table 1 for correlation metrics of all parameters indicated in B.