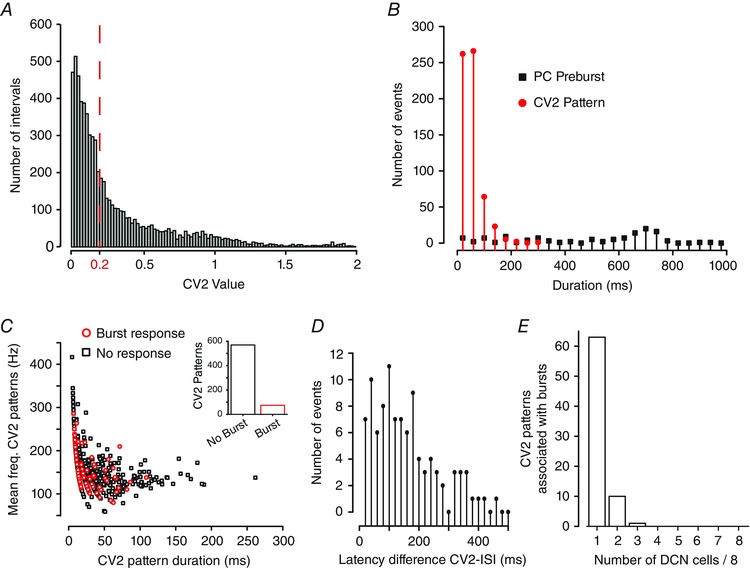
Figure 8. CV2 defined patterns in Purkinje cell firing are not reliably associated with DCN cell burst responses .

A, histogram plot of the CV2 scores for each ISI in the Purkinje cell stimulus input pattern (0.02 bin width). The red dashed line indicates the threshold CV2 below which ISIs are deemed to belong to a pattern (as in Shin et al. 2007), defining 643 patterns. B, plots of the number of defined CV2 patterns in the Purkinje cell stimulus input file of a given duration compared to the duration of Purkinje cell frequency increases preceding a defined burst ISI in Transient burst cells (see Fig. 7 A). Data are binned at 20 ms. C, scatter plot of Purkinje cell spike frequency versus duration of CV2 patterns sorted for those associated with a DCN burst response (red) or no burst response (black). Inset: the number of patterns that did or did not associate with DCN bursts. D, plot of the latency difference between DCN cell burst ISIs and CV2‐defined patterns in Purkinje cell firing that occur within a 500 ms window preceding burst ISIs (10 ms bin width). E, bar plots of the number of DCN cells in which a burst ISI was detected within 500 ms of a specific CV2‐defined pattern in the Purkinje cell stimulus input when presented to eight Transient burst cells.
