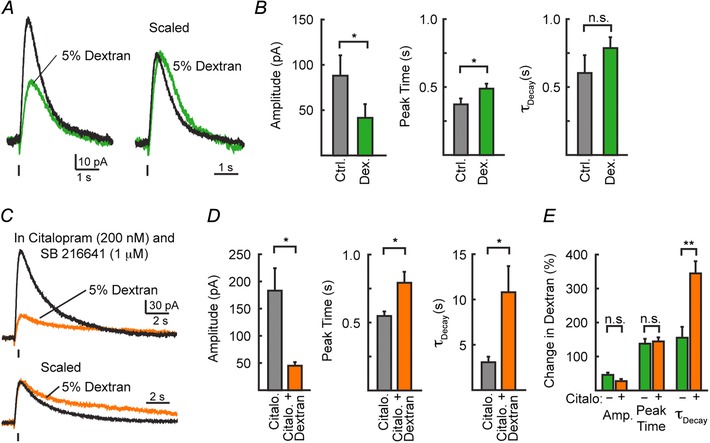
Figure 4. Slowing diffusion of serotonin alters the amplitude and kinetics of 5‐HT1A‐IPSCs .

A, average traces of IPSCs recorded before (black) and during (green) the bath application of 5% dextran. B, quantification of the amplitude, peak time, and decay kinetics of IPSCs recorded in A. C, average traces of IPSCs before (black) and during (green) the bath application of 5% dextran recorded in the continuous presence of citalopram (200 nm) and SB 216641 (1 μm). When serotonin reuptake transporters and presynaptic autoreceptors were inhibited, slowing diffusion greatly prolonged the decay of 5‐HT1A‐IPSCs. D, quantification of the amplitude, peak time, and decay kinetics of IPSCs recorded in E. Relative change in IPSCs in the presence of dextran with and without citalopram (200 nm).
