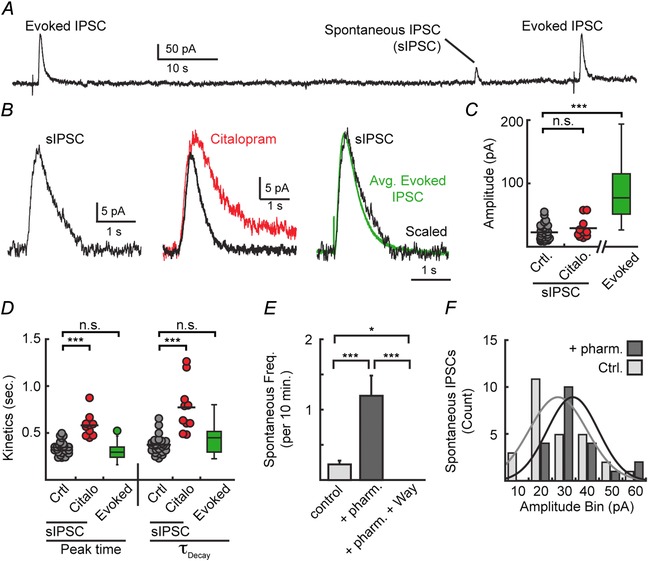
Figure 6. Spontaneous 5‐HT1A receptor‐mediated currents have similar kinetics to evoked IPSCs .

A, representative trace of evoked and spontaneous IPSCs. B, average spontaneous IPSCs (sIPSC, left) overlaid with average sIPSCs recorded in citalopram (200 nm, centre) and average evoked 5‐HT1A‐IPSCs (right). C, quantification of the amplitudes of sIPSCs recorded in control bath and citalopram vs. evoked IPSCs (ANOVA, P < 0.001). D, quantification of the kinetics of the spontaneous IPSCs recorded in control bath and citalopram (200 nm) compared to evoked 5‐HT1A‐IPSCs (ANOVA: peak time P < 0.001, τDecay P < 0.001). sIPSCs recorded in control bath had similar kinetics to evoked IPSCs. E, inclusion of phenylephrine (3 μm), forskolin (1 μm), DPCPX (500 nm), and citalopram (50 nm) in the bath increased the frequency of sIPSCs (pharm.). Further addition of WAY 100635 (200 nm) abolished sIPSCs (ANOVA P < 0.001). F, histogram demonstrating that sIPSCs had significantly greater amplitudes (P = 0.04; n = 21 pharm.; n = 27 ctrl.) in the pharmacological bath (from E) compared to control bath. *P < 0.05; ***P < 0.001; n.s., P > 0.05.
