
Figure 2. hCSF increases spontaneous firing in FS and NFS interneurons .
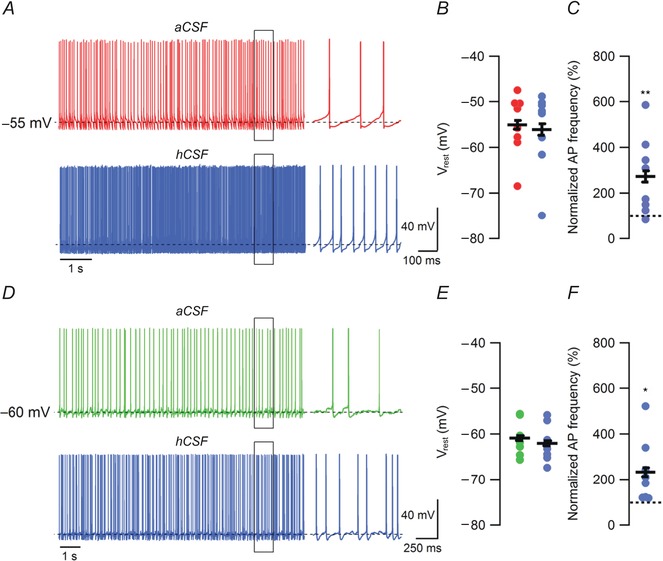
A, example traces of spontaneous firing in aCSF and hCSF (after 10 min), at V rest, in FS interneurons. APs expanded in time from highlighted area (black rectangle) are shown to the right. B, summary bar graph showing effect of hCSF on V rest in FS interneurons. C, summary bar graph showing normalized effect of hCSF on spontaneous firing frequency at V rest in FS interneurons. D, example traces of spontaneous firing in aCSF and hCSF (after 10 min), at V rest, in NFS interneurons. APs expanded in time from highlighted area (black rectangle) are shown to the right. E, summary bar graph showing effect of hCSF on V rest in NFS interneurons. F, summary bar graph showing normalized effect of hCSF on spontaneous firing frequency at V rest in NFS interneurons. Error bars represent SEM. *P < 0.05; **P < 0.01.