
Figure 3. hCSF reduces after‐hyperpolarizing potentials of spontaneous APs in FS and NFS interneurons .
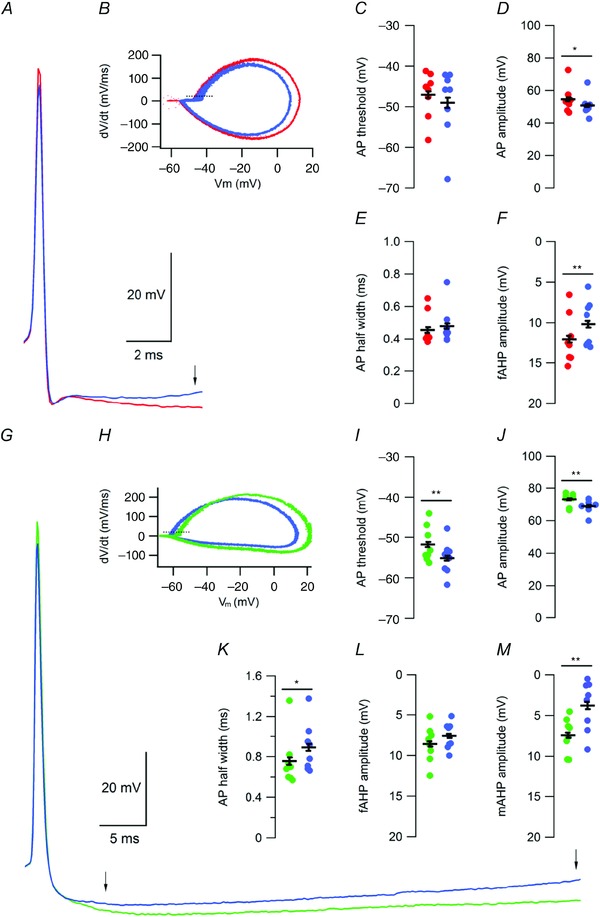
A, example of spontaneous AP waveform of FS interneurons recorded in aCSF (red) and hCSF (blue). Arrow indicates point of fAHP amplitude measurement. B, representative phase‐plane plot constructed from spontaneous APs recorded over 60 s in aCSF (red) and hCSF (blue), in FS interneurons. Dashed line indicates a dV/dt of 20 mV ms−1. C–F, summary graphs showing effect of hCSF on spontaneous AP threshold (C), amplitude (D), half width (E) and fAHP amplitude (F). G, example of spontaneous AP waveform of NFS interneurons recorded in aCSF (green) and hCSF (blue). Arrows indicate point of fAHP (left arrow) and mAHP (right arrow) amplitude measurement. H, representative phase‐plane plot constructed from spontaneous APs recorded over 60 s in aCSF (green) and hCSF (blue), in NFS interneurons. Dashed line indicates a dV/dt of 20 mV ms−1. I–M, summary graphs showing effect of hCSF on spontaneous AP threshold (I), amplitude (J), half width (K), fAHP amplitude (L) and mAHP amplitude (M). Error bars represent SEM. *P < 0.05; **P < 0.01.