
Figure 6. Increased responsiveness of FS and NFS interneurons to sinusoidal current stimulation at theta and gamma frequency in hCSF .
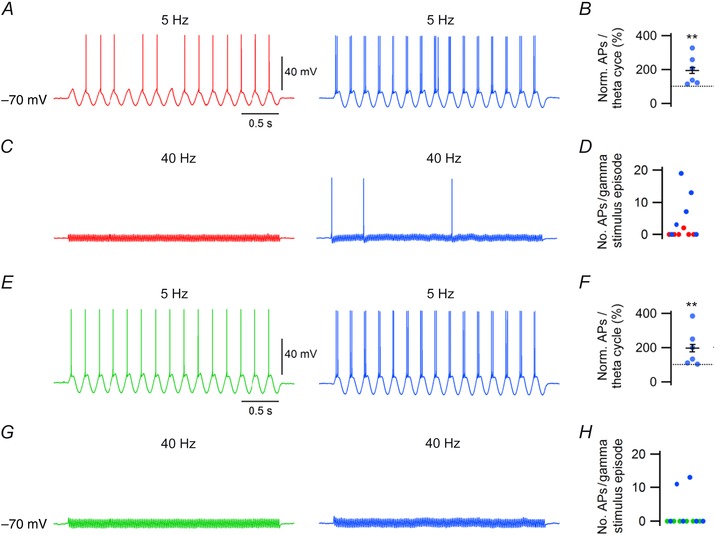
A, example traces of FS interneuron firing in response to 5 Hz sinusoidal current stimulation at –70 mV in aCSF (red) and hCSF (blue). B, summary bar graph showing normalized AP firing in response to each theta cycle in aCSF and hCSF. C, example traces of FS interneuron responses to 40 Hz sinusoidal current stimulation at –70 mV in aCSF (red) and hCSF (blue). D, graph showing number of APs fired by individual FS neurons during a 3 s gamma stimulus episode in aCSF and hCSF. E, example traces of NFS interneuron firing in response to 5 Hz sinusoidal current stimulation at –70 mV in aCSF (green) and hCSF (blue). F, summary bar graph showing normalized AP firing in response to each theta cycle in aCSF and hCSF. G, example traces of NFS interneuron responses to 40 Hz sinusoidal current stimulation at –70 mV in aCSF (green) and hCSF (blue). H, graph showing number of APs fired by individual NFS neurons during a 3 s gamma stimulus episode in aCSF and hCSF. Error bars represent SEM. **P < 0.01.