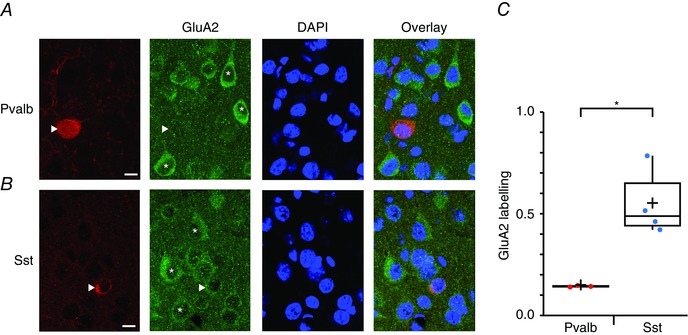
Figure 1. Lower GluA2 immunolabelling in Pvalb‐positive than in Sst‐positive INs .

A, confocal images of coronal sections of L5 visual cortex from a P21 WT mouse stained with DAPI and immunolabelled with antibodies against Pvalb and GluA2 (single optical slice). The image furthest to the right is a composite of the three to its left. The Pvalb‐positive IN (arrowhead) lacks GluA2 labelling. Asterisks indicate PCs labelled for GluA2. Scale bar = 10 μm. B, as in (A), but for an Sst‐positive IN in an acute slice from another P21 WT mouse. The Sst‐positive IN (arrowhead) is positively labelled for GluA2, although less so than in nearby PCs (asterisks). C, boxplot quantifying the considerably lower GluA2 expression in Pvalb‐positive compared to Sst‐positive INs. IN GluA2 labelling was quantified as the fluorescence intensity less background with PC GluA2 labelling as a normalizing reference (see Methods). For Pvalb‐positive cells, data were from three mice (nine stacks; 156 background ROIs, 171 PCs and 116 Sst‐positive INs). For Sst‐positive cells, data were from four mice (12 stacks;146 background ROIs, 145 PCs and 61 Sst‐positive INs).
