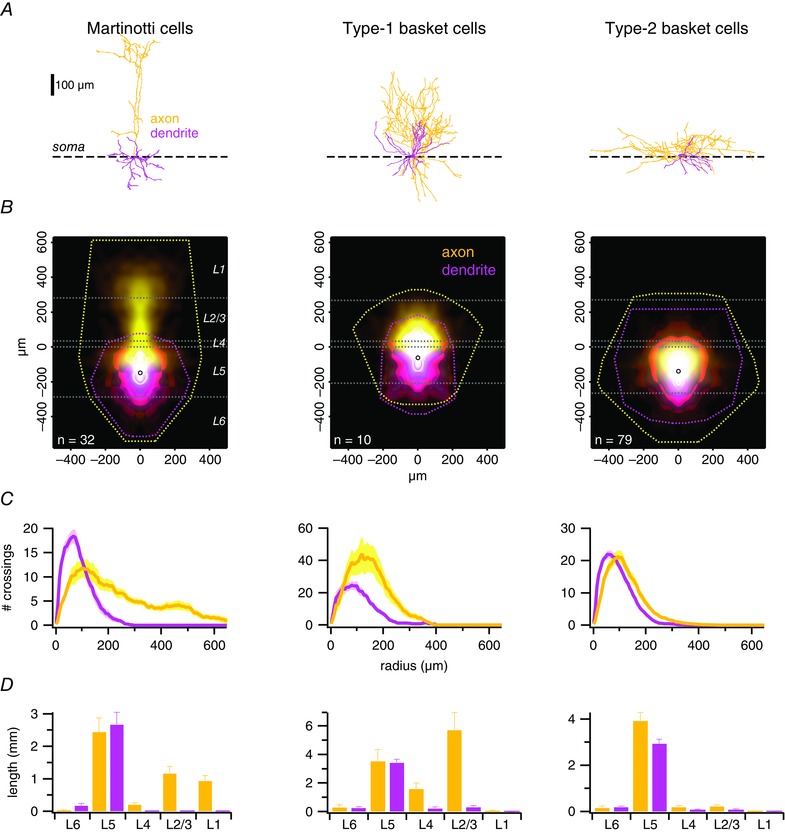
Figure 2. Laminar distribution of axon identified MCs and two types of BCs .

A, sample MC, type‐1 and type‐2 BC morphologies, aligned on their somata (dashed line). B, ensemble density maps (see Methods) (Buchanan et al. 2012) of all recorded INs show typical axonal (yellow) and dendritic (magenta) arborizations. Convex hulls (dashed lines) illustrate maximum axonal and dendritic extents. Open circles indicate the average position of cell bodies. Horizontal white dashed lines denote the neocortical layer boundaries averaged across cells. C, ensemble Sholl diagrams show the number of axonal (yellow) or dendritic (pink) branches crossing a given radial distance from the soma (Sholl, 1953). The prominent ascending axon of type‐1 BCs distinguishes them from the classical type‐2 BCs, whose peak axonal radial density is closer to the soma (Buchanan et al. 2012; Ferreira et al. 2014). D, total length of axonal arbours (yellow) within a neocortical layer distinguished different cell types well, whereas the dendritic branching pattern (magenta) was less useful for classification. Axons of type‐1 but not of type‐2 BCs branched extensively in L2/3 but never reached L1. MC axons, however, consistently reached L1.
