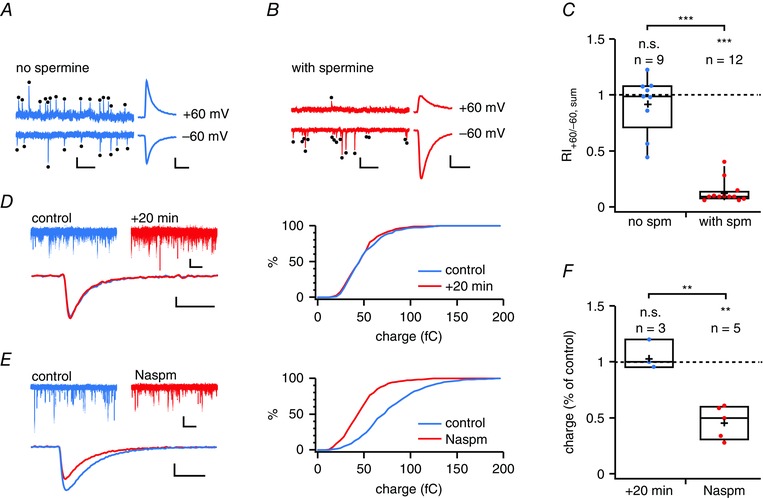
Figure 8. Rectification of BC mEPSCs is spermine‐dependent .

A, representative BC mEPSCs (black dots) recorded at –60 mV and +60 mV using spermine‐free internal solution. Scale bars = 100 ms, 50 pA. Right: average of all mEPSCs at +60 mV and count‐matched average at –60 mV are of similar absolute amplitudes, suggesting an absence of rectification. Scale bars = 2 ms, 20 pA. B, as in (A) but for a BC recorded with internal solution supplemented with spermine. Right: average of all mEPSCs at +60 mV is of smaller absolute amplitude than the count‐matched average at –60 mV, indicating rectification. Scale bars as in (A). C, BC mEPSC rectified in the presence (red) but not the absence of spermine (blue, P = 0.37 for the comparison with 1), suggesting CP‐AMPAR‐mediated quantal currents. The RI of mEPSCs was different from that without spermine. The rectification index, RI+60/–60, was calculated from the summed charge (see Methods). Half of the cells were targeted in the Pvalb‐positive G42 mouse line (6/12 for ‘with spm’ and 5/9 for ‘no spm’) (Chattopadhyaya et al. 2004). D, representative control recording at –60 mV showing that the mEPSC charge remained stable for 20 min (P = 0.95 using the Kolmogorov–Smirnov test). Scale bars: top = 500 ms, 20 pA; bottom = 2 ms, 10 pA. E, Naspm wash‐in reduced the mEPSC charge (P < 0.01, Kolmogorov–Smirnov), suggesting the presence of CP‐AMPARs. Scale bars as in (D). F, mEPSC summed charge was unaffected by mock wash‐in (P = 0.56 for comparison with 100%), whereas bath application of Naspm approximately halved the mEPSC summed charge, indicating the cell‐wide presence of CP‐AMPARs in BCs. All cells were WT. Mini frequency (12 ± 3 Hz) was typical of BCs (Buchanan et al. 2012).
