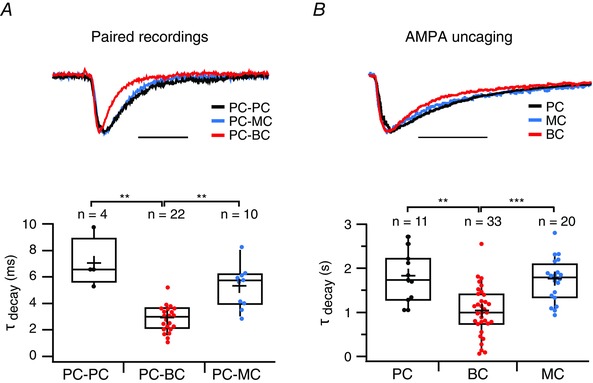
Figure 9. AMPAR currents decay faster in BCs than in PCs and MCs .

A, top: representative voltage‐clamp traces showing faster decay kinetics at a PC‐BC synapse (red) than at a PC‐PC (black) and a PC‐MC connection (blue). Scale bar = 10 ms. A, bottom: the decay time constant, τdecay, was faster for PC‐BC (red) than for PC‐PC (black) and PC‐MC (blue) connections. PC‐PC and PC‐MC connections were indistinguishable with respect to τdecay (P = 0.06). PC‐BC synapses were measured at –100 mV or at –80 mV and, because the decay times at these two voltages were indistinguishable, these data were pooled (τdecay,–100 mV = 2.8 ± 0.3 ms, n = 14 pairs and τdecay,–80 mV = 3.2 ± 0.3 ms, n = 8 pairs, P = 0.22, data not shown). B, top: representative voltage‐clamp traces showing AMPA‐uncaging responses with faster decay kinetics in BCs (red) than in PCs (black) and MCs (blue). Scale bar = 2 s. B, bottom: the decay time constant, τdecay, was faster for AMPA uncaging responses in BCs (red) than in PCs (black) and MCs (blue). Data were acquired at either –100 mV or at –80 mV, and were pooled because the decay time constants at these two voltages were indistinguishable (BCs: τdecay,–100 mV = 1.0 ± 0.1 s, n = 19 cells, τdecay,–80 mV = 1.1 ± 0.1 s, n = 14 cells, P = 0.7; MCs: τdecay,–100 mV = 1.8 ± 0.1 s, n = 10 cells, τdecay,–80 mV = 1.2 ± 0.4 s, n = 10 cells, P = 0.2; PCs: τdecay,–100 mV = 2.0 ± 0.3 s, n = 5 cells, τdecay,–80 mV = 1.6 ± 0.2 s, n = 6 cells, P = 0.2; data not shown). For BCs, τdecay, –100 data were pooled for with and without internal spermine because these conditions were indistinguishable (τdecay, –100, spm+ = 1.1 ± 0.2 s; n = 11; τdecay, –100, spm– = 0.9 ± 0.2 s, n = 8; P = 0.5). Uncaging responses recorded in PCs and in MCs were indistinguishable with respect to τdecay (P = 0.24).
