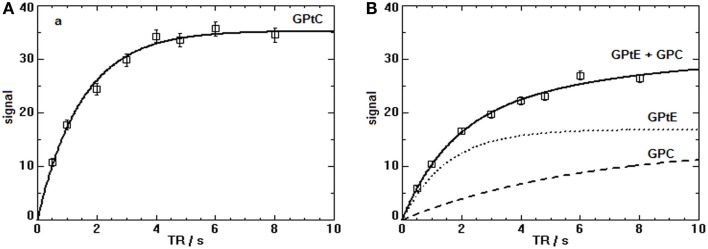
Figure 4.
T1-fits of the progressive saturation measurements for the PDE signals (sum of five volunteers) in the breast at 7 T. (A) The T1-value of the GPtC signal (mono-exponential decay) is 1.2 ± 0.3 s. (B) The (GPtE + GPC) signal for the five volunteers was fitted bi-exponentially with a fixed short T1 component for GPtE taken equal to GPtC leading to a T1 for GPC of 3.2 ± 0.6 s.

