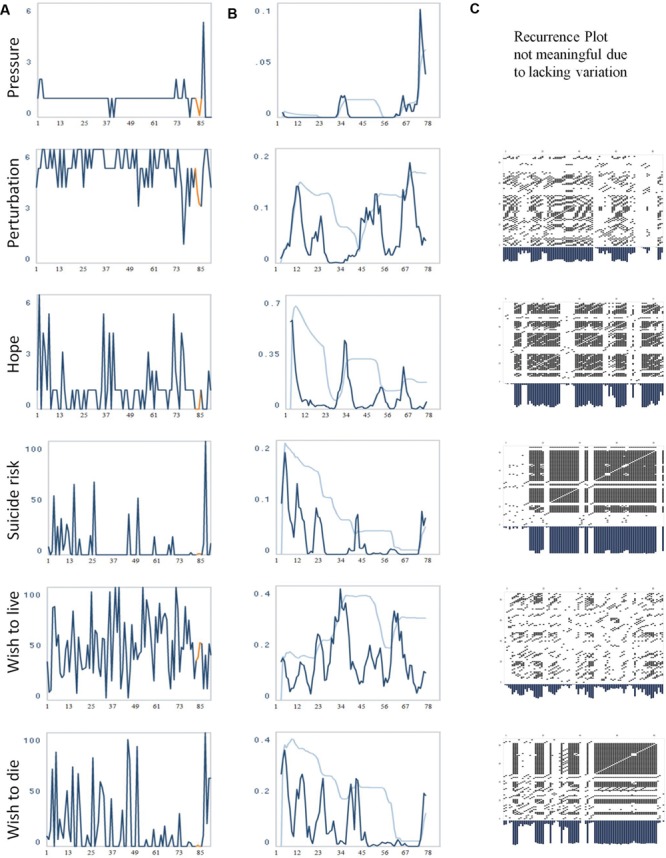
FIGURE 1.

(A) Evolution of the items “pressure,” “perturbation,” “hope,” “suicide risk,” “wish to live,” and “wish to die.” The numbers on the x-axis correspond to days of monitoring. (B) The evolution of the dynamic complexity corresponding to these items (calculated in a moving window of 7 data points [=days]). The two additional curves (light blue) represent a 95 and 99% confidence interval, calculation based on 21 data points. The numbers on the x-axis correspond to days of monitoring. (C) Recurrence Plots of the time series. Each of the items was embedded into a three-dimensional phase space with delay 1 (t-1, t-2, t-3). Radius: 20 (item 10/Perturbation), 18 (item 11/Hope), 13 (item 14/Suicide risk), 25 (item 15/Wish to live), 25 (item 16/Wish to die). Periods of instability or transients have reduced recurrence, i.e., very few dots, and correspond to increased dynamic complexity (middle column), and vice versa, periods with distinct recurrent signature correspond to a restricted dynamic complexity.
