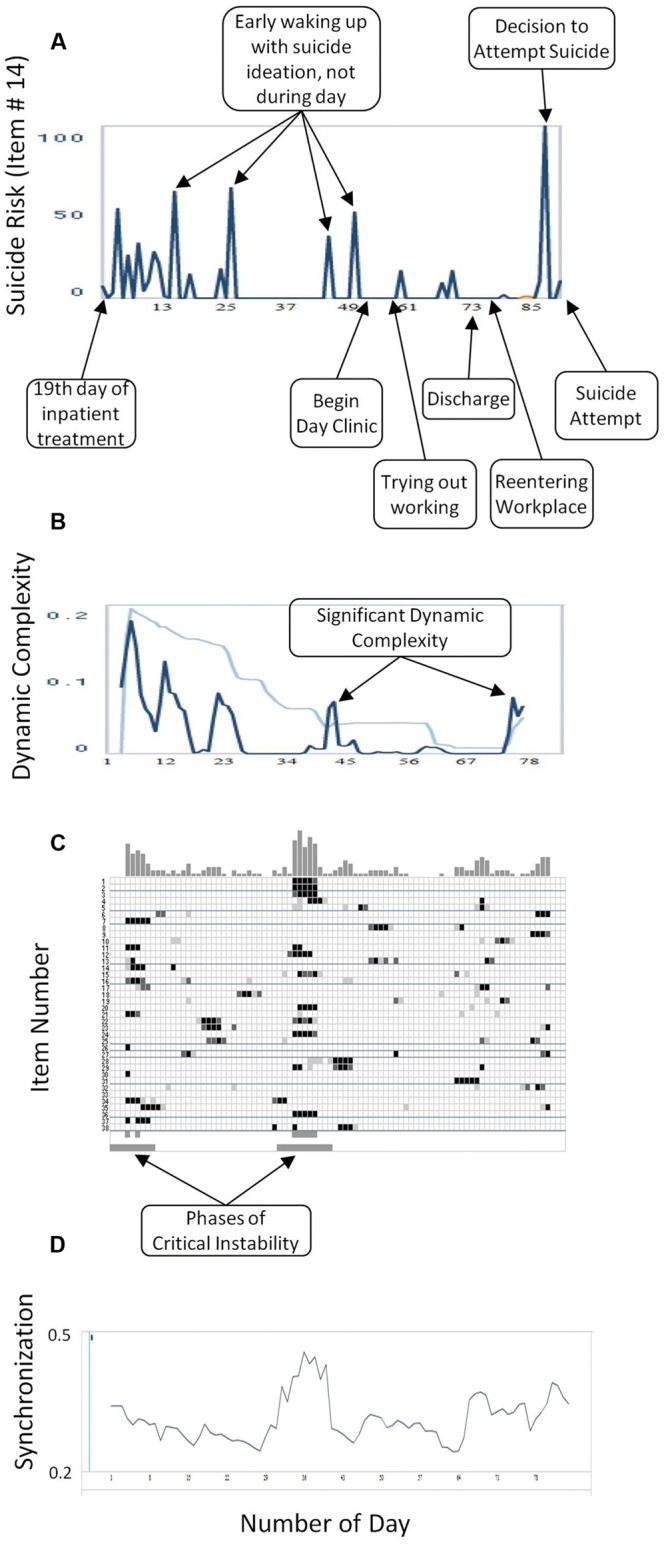
FIGURE 2.

(A) Critical Incidents: the numbers on the x-axis correspond to days of monitoring. (B) Dynamic Complexity of item # 14 (blue line) and the confidence interval (light blue line). Increases of dynamic complexity indicate periods of critical instabilities in a change process. The dynamic complexity is calculated in a gliding window with window width of 7 points. The numbers on the x-axis correspond to days of monitoring. (C) Complexity Resonance Diagram: each row represents one item of the Salzburg Suicide Process Questionnaire. Light gray, dark gray, or black dots indicate three significance levels of the dynamic complexity (p < 0.050, p < 0.025, p < 0.010, respectively). The Complexity Resonance Diagram indicates periods of significantly increased complexities getting in resonance to each other, and by this, appear at the same time (vertical structures). Usually, those periods can be seen as the critical instabilities of a process. In this Complexity Resonance Diagram the two critical periods of the 3 months of monitoring are marked below. The top histogram summarizes dynamic complexities across items. (D) Synchronization: degree of intercorrelation between items. The numbers on the x-axis correspond to days of monitoring.
