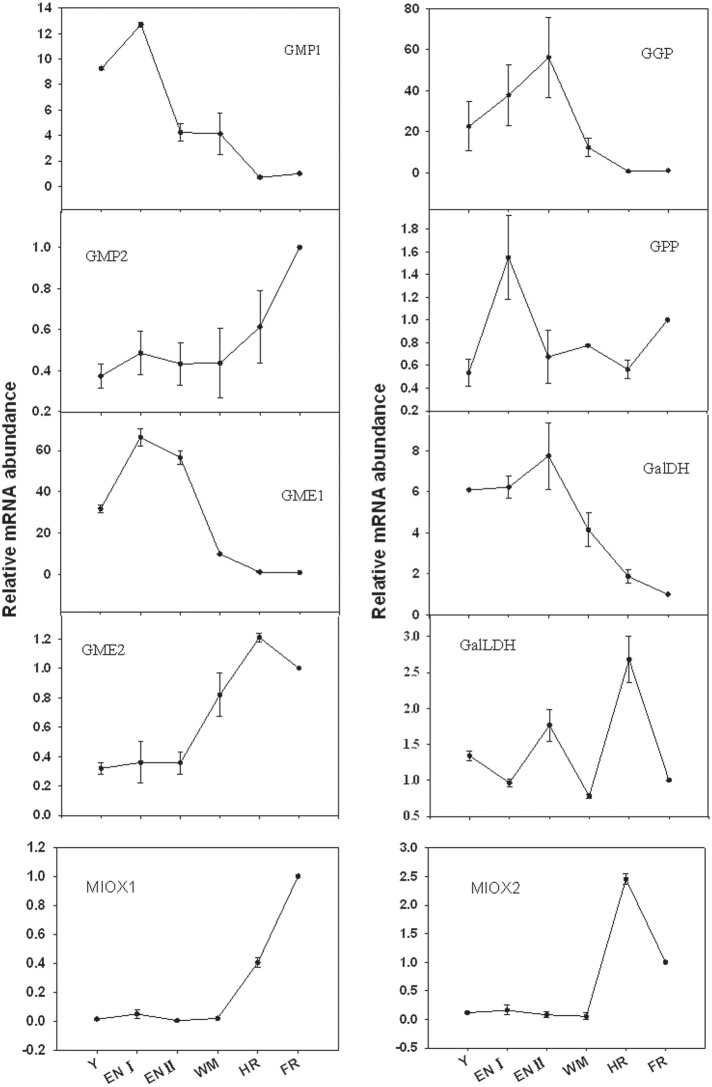
Figure 4.
Relative expression levels of genes involved in the L-galactose and myo-inositol AsA biosynthetic pathways in fruit of Z. jujuba Mill. (Y, young stage; EN I, enlargement I stage; EN II, enlargement II stage; WM, white mature stage; HR, half-red stage; FR, full-red stage). Results are normalized to the expression value of full-red fruit, which was set to 1. Data are expressed as the means ± SD of three replicates.

