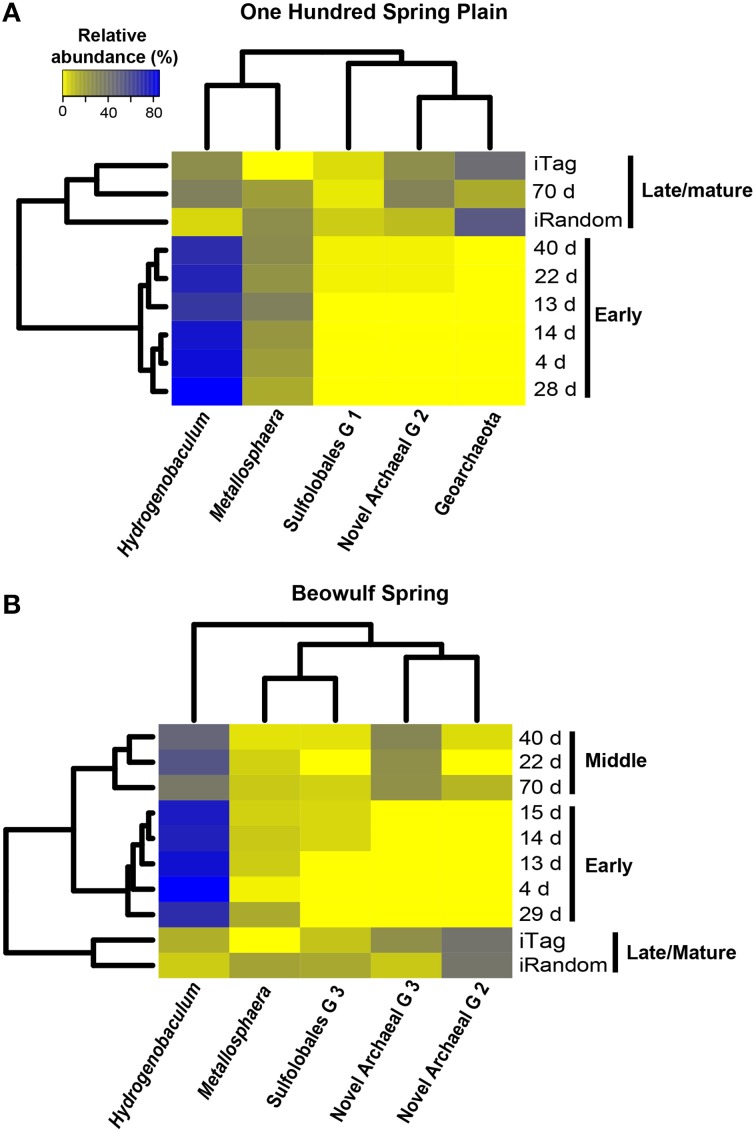
Figure 6.
Relative abundance (16S rRNA gene Illumina barcodes) of different phylotypes determined on slides incubated in One Hundred Spring Plain (A) and Beowulf (B) Springs from 4 to 70 days. The dendrograms on the y and x axes represent the Bray-Curtis dissimilarity matrix between taxon abundance at different time points and taxon abundances, respectively.

