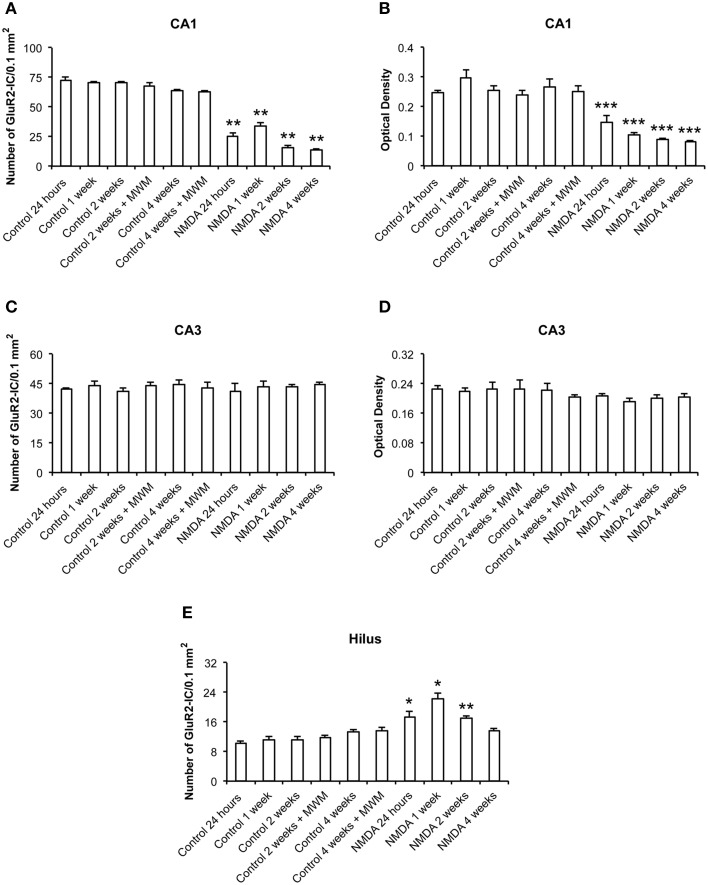
Figure 6.
Number of GluR2-immunopositive cells (A,C,E) and optical density (B,D) in CA1, CA3, and hilus of the control and NMDA groups evaluated at 24 h, 1, 2, and 4 weeks after intrahippocampal injection. Data represent mean ± SEM of the number of cells and optical density quantified bilaterally in three sections/rat (n = 6/group). *p < 0.05; **p < 0.01; ***p < 0.001 (one-way ANOVA followed by Newman–Keuls test).

