Figure 7.
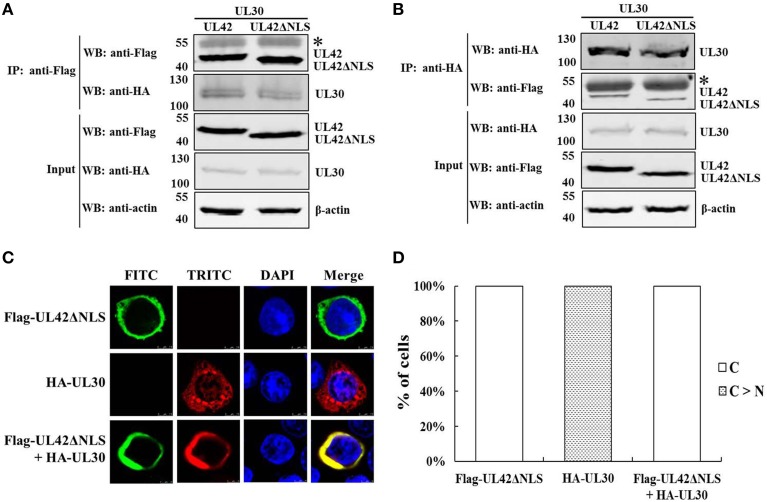
An UL42 NLS-null mutant confined the PRV DNA polymerase holoenzyme to the cytoplasm. (A) Co-IP of HEK293T cells transfected with pCMV-Flag–UL42ΔNLS and/or pCAGGS-HA–UL30. IP was performed with an MAb recognizing the Flag tag, and the western blotting (WB) was probed with the antibodies indicated on the left. The cytoskeletal protein β-actin was used as the internal control. The asterisk indicates the heavy chain of IgG. The positions of the molecular mass markers (kDa) are indicated on the left. The WB results are representative of three or more independent experiments. (B) Reverse Co-IP of HEK293T cells transfected with pCMV-Flag–UL42ΔNLS and/or pCAGGS-HA–UL30. IP was performed with an MAb recognizing the HA tag, and the WB was probed using the antibodies indicated on the left. The cytoskeletal protein β-actin was used as the internal control. The asterisk indicates the heavy chain of IgG. The positions of the molecular mass markers (kDa) are indicated on the left. The WB results are representative of three or more independent experiments. (C) HeLa cells transfected with pCMV-Flag–UL42ΔNLS and/or pCAGGS-HA–UL30 were analyzed by immunofluorescence assays using an MAb recognizing the Flag tag (FITC, green) and/or a PcAb recognizing the HA tag (TRITC, red). The DNA was stained with Hoechst reagent (DAPI, blue). The merged FITC, TRITC, and DAPI signals are shown. Image for each construct is representative of three independent transfection experiments. (D) To analyze the localization patterns of Flag–UL42ΔNLS and HA–UL30 statistically, 100 positive cells expressing Flag–UL42ΔNLS or HA–UL30 or coexpressing Flag–UL42ΔNLS and HA–UL30 were scored from independent transfections in three repeated experiments and the relative percentages of the different subcellular localization categories were calculated. C > N, more cytoplasmic than nuclear; C, strictly cytoplasmic.

