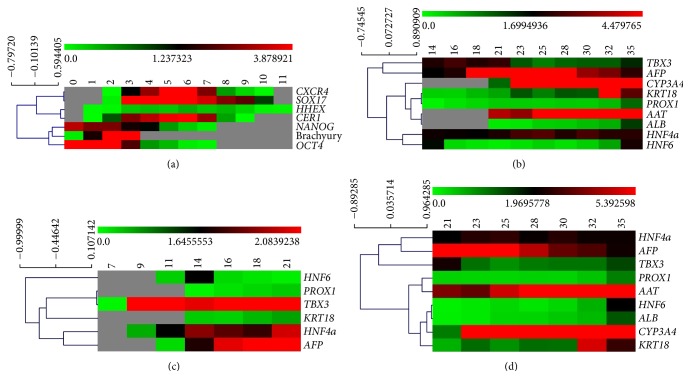
Figure 14.
Clustering analysis. The genes included in the study were clustered applying Spearman rank correlation. Colors indicate RQ according to the scale shown above each heatmap. Missing values are indicated by gray color. (a) Clustering results for days 0 to 11, (b) days 14 to 35, (c) days 7 to 21, and (d) days 21 to 35.

