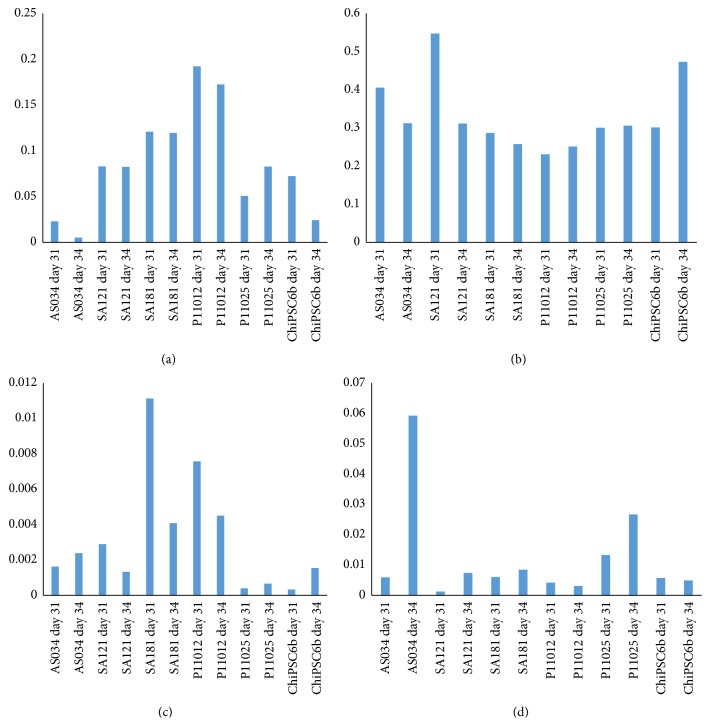
Figure 15.
Bar graph showing the RNA expression levels of the drug transporters (a) SLC10A1 (NTCP), (b) ABCC2 (MRP2), (c) SLCO1B1 (OATP1B1), and (d) ABCB11 (BSEP). The x-axis indicates the hPSC lines at days 31 and 34 of the hepatic differentiation. The y-axis indicates RQ, where the calibrator's RQ = 1. The calibrator was an RNA pool of freshly isolated human primary hepatocytes from 5 different donors.

