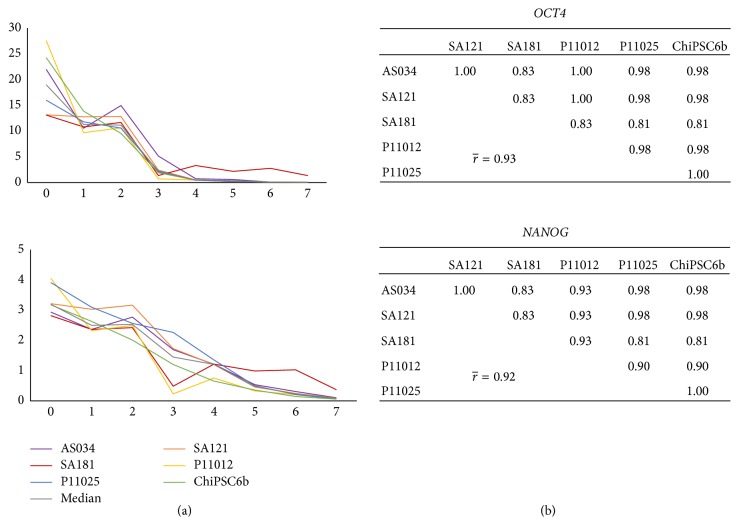
Figure 3.
Gene expression profiles of the pluripotent markers OCT4 and NANOG. (a) The x-axis indicates the days during differentiation and the y-axis indicates relative quantification (RQ) where the calibrator's RQ = 1. The colored lines show the results from each individual hPSC line and the grey line indicates the calculated median value of the RNA level. (b) Correlation tables show very strong correlations between the cell lines, with an average pairwise correlation of 0.93 for OCT4 and 0.92 for NANOG for the interval of day 0 to day 7.

