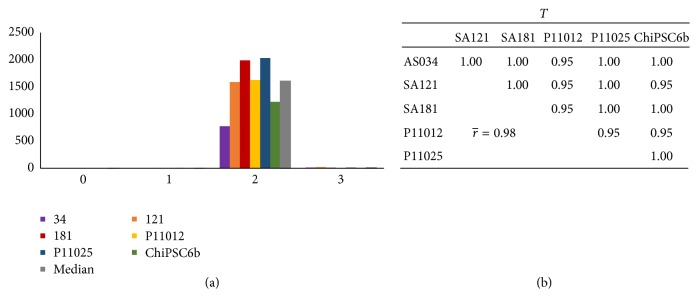
Figure 4.
(a) Bar graph showing the RNA expression levels of the primitive streak marker T. The x-axis indicates the day of differentiation and the y-axis indicates RQ, where the calibrator's RQ = 1. All six cell lines express the T gene essentially only at day 2; therefore, the correlation between cell lines for the interval of day 0 to day 3 is very strong as indicated in (b).

