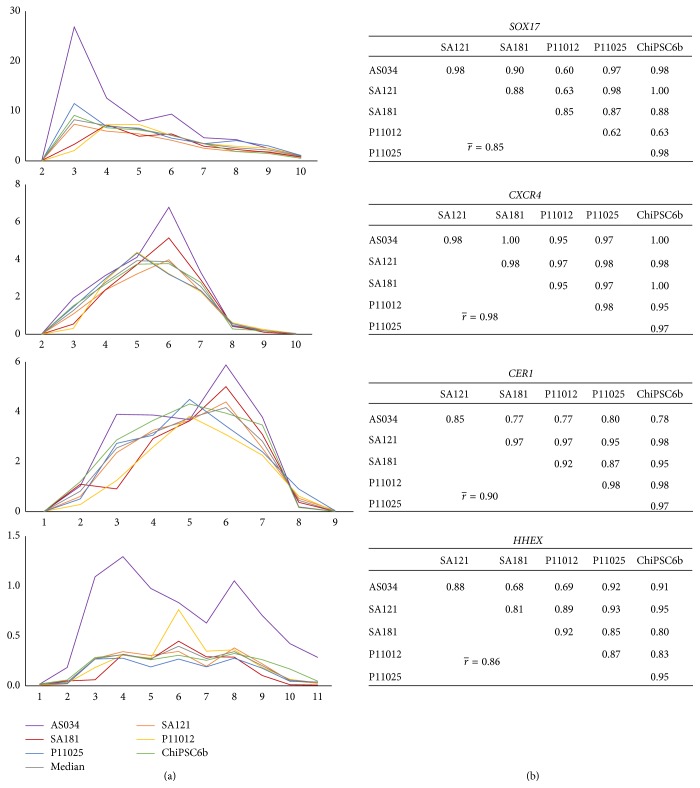
Figure 5.
Gene expression profiles for DE (SOX17, CXCR4, and CER1) and ventral foregut endoderm (HHEX) markers in the interval from day 1 to day 11. (a) The x-axis indicates the days during differentiation and the y-axis indicates RQ, where the calibrator's RQ = 1. The colored lines show the results from each individual hPSC line and the grey line indicates the calculated median value of the RNA level. Correlation tables are shown in (b). The time points before the onset of expression and after the RNA levels have decreased below the detection limit are not included in the analysis (e.g., day 1 and day 11 were excluded for SOX17). In general, the correlation between cell lines for all these markers is very strong. DE cells seem to emerge at day 3 and disappear at day 8.

