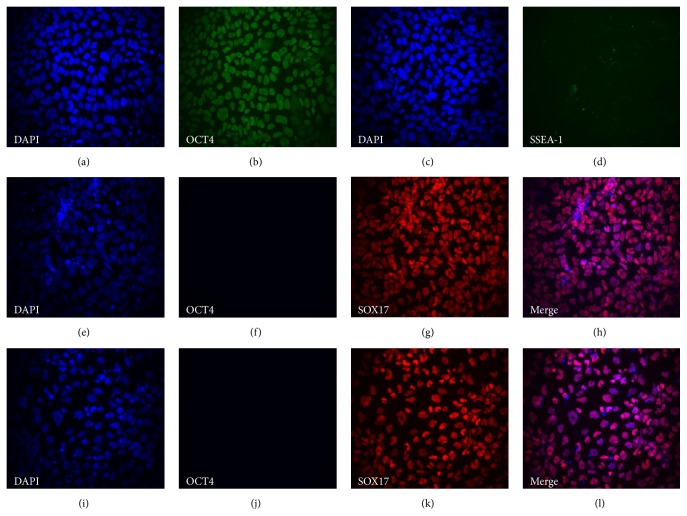
Figure 8.
Representative micrographs from immunocytochemical analysis at days 0, 5, and 7 during hepatic differentiation of the cell line AS034. Magnification: 20x. Panels (a)–(d) show staining of undifferentiated hPSC at day 0: (a) and (c) show nuclear DAPI staining, (b) shows Oct4 staining, and (d) shows SSEA-1 staining. Panels (e)–(h) show staining of DE cells at day 5 of differentiation: (e) shows nuclear DAPI staining, (f) shows Oct4 staining, (g) shows Sox17 staining, and (h) shows a merge of DAPI and Sox17 staining. Panels (i)–(l) show staining of DE cells at day 7 of differentiation: (i) shows nuclear DAPI staining, (j) shows Oct4 staining, (k) shows Sox17 staining, and (l) shows a merge of DAPI and Sox17 staining.

