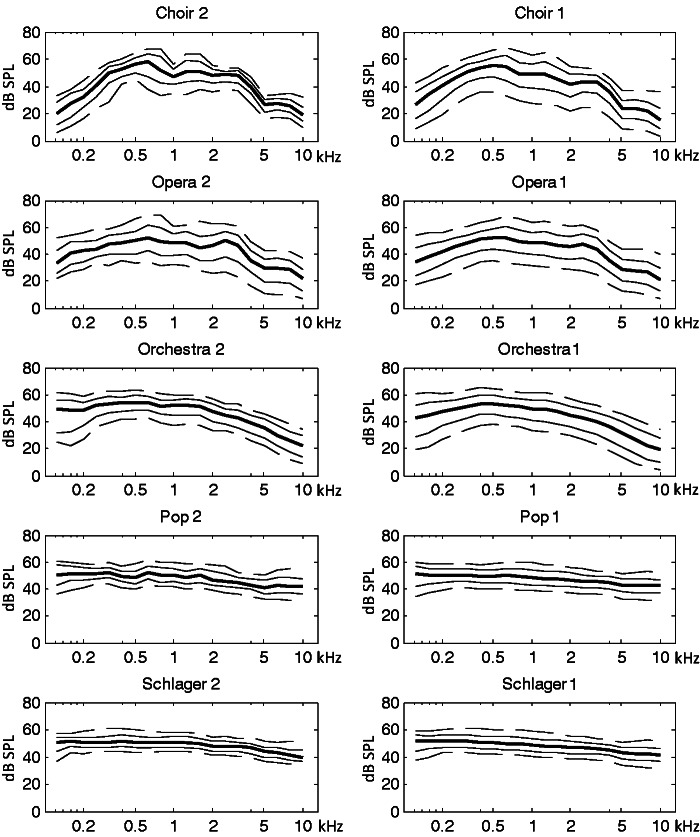
Figure 5.
Dynamic range of the test sample in Experiment 2 (left column) and the audio corpus in Experiment 1 (right column) for the genres choir, opera, orchestra, pop, and schlager. The lines represent percentiles in dB (SPL) across frequency in kHz (99th: upper dashed line, 90th: upper solid line, 65th: thick line, 30th: lower solid line, and 10th: lower dashed line).

