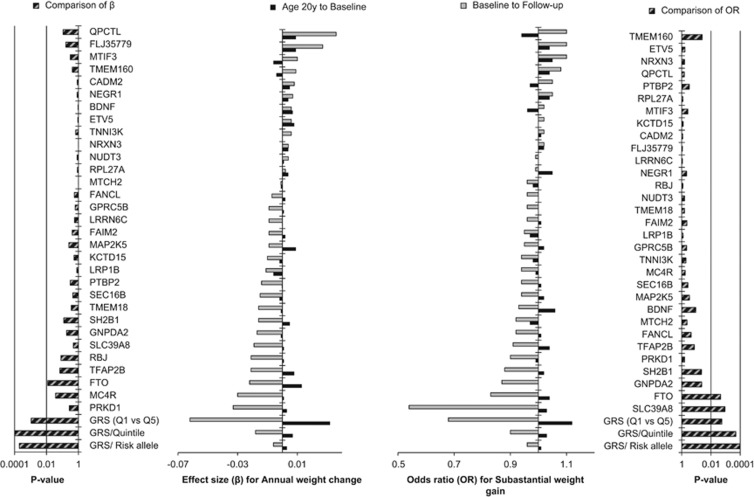
Figure 3.
Comparison of effect estimates for annual weight change and odds ratios for substantial weight gain for 31 BMI-associated variants, and their GRS from age 20 years to baseline with the same effect estimates and odds ratios from baseline to follow-up in MDCS. Black bars present the estimates (effect size or odds ratio) from age 20 years to baseline and the gray bars represent estimates from baseline to follow-up. SNPs are arranged based on the increasing order of estimates from baseline to follow-up. Striped bars indicate P-values for the comparison of estimates that were calculated using seemingly unrelated estimations.

