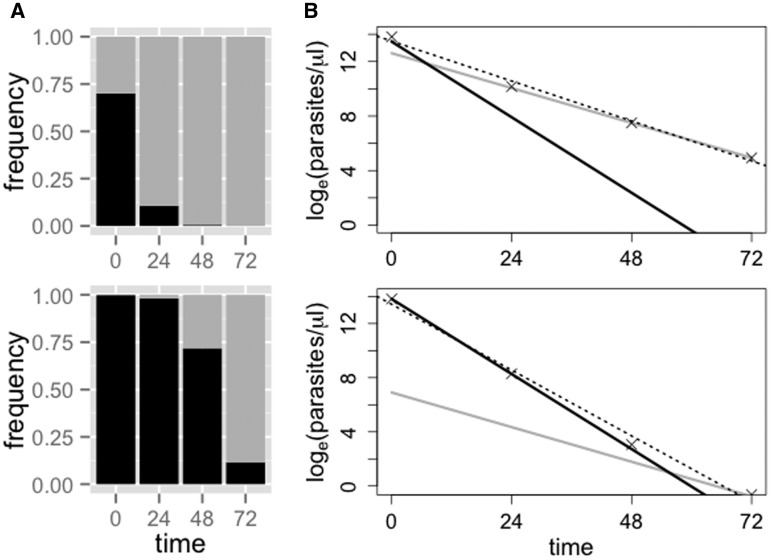
Figure 1.
Clearance curves and determination of ‘clones’ by deep sequencing. Predicted relative abundances (A) and clearance curves (B) for hypothetical infections composed of sensitive (black, 3-h half-life) and resistant (gray, 6.5-h half life) parasite clones after drug treatment. The initial frequency of the resistant clone is 25% in the top row and 1% in the bottom row. In (B), the dotted line shows the standard parasite clearance curve, as fitted to the total parasite density. The half-life estimates from these curves, for the whole infection, are ∼5.5 h (top) and ∼4 h (bottom). When the resistant clone is rare it exerts little effect on the overall estimate of parasite half-life

