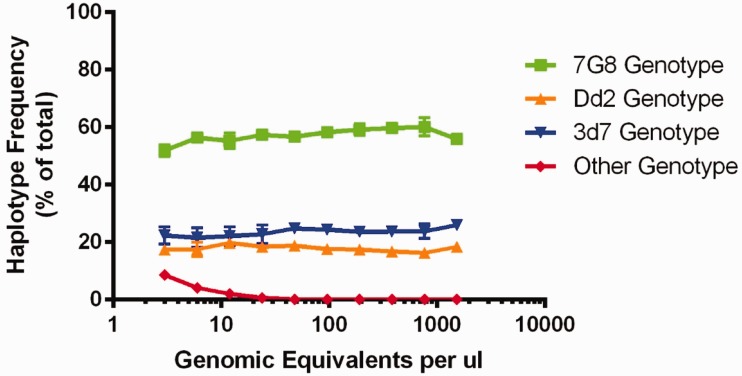
Figure 3.
Deep sequencing of control mixtures. The detected haplotype frequencies of the dilution series are shown, with parasitemias ranging from three genomic equivalents per microliter (GE/µl) to 1536 GE/µl. Each point represents the mean (dot) and 1 SD (error bars) of triplicate experiments. Each experiment involves two PCR replicates used to call haplotypes with a fixed minimum cutoff frequency of 0.5% using SeekDeep. Overall, there is little variation in the frequency estimates within a concentration and between concentrations. Beginning at 24 GE/µl, false-positive haplotypes begin to be detected. Plotted here is the sum total frequency of false haplotypes (red line). Individual samples could contain between 1 and 4 false haplotypes, which individually never exceeded 6% within a single experiment

